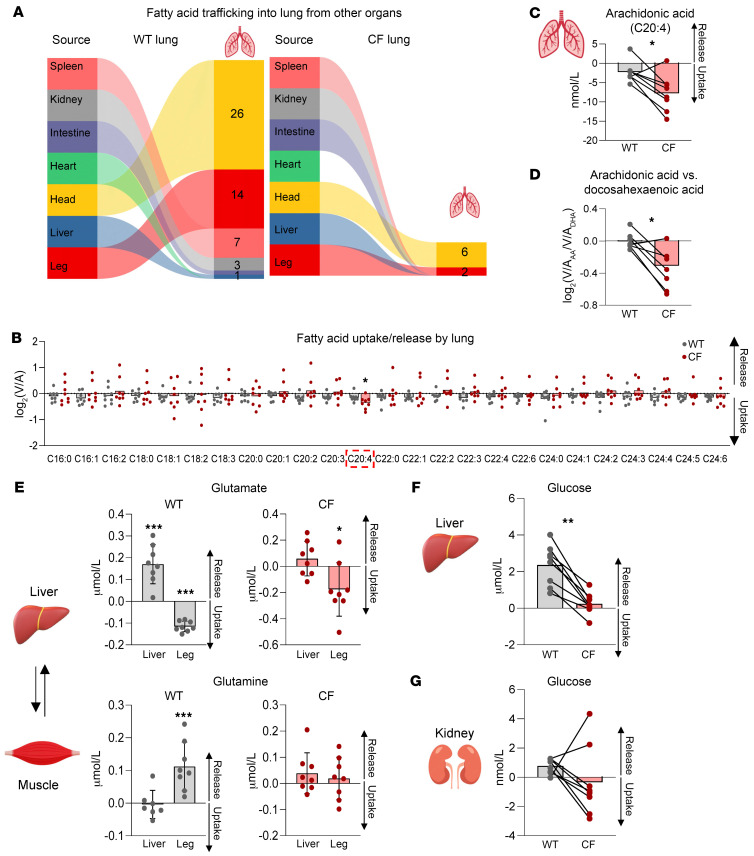
Figure 3. Quantitative analysis reveals altered metabolite trafficking in CF lungs, liver, and legs.
(A) Graphs indicating fatty acid trafficking into lungs from other organs. (B) log2(V/A) ratios of LCFAs in WT and CF lungs. n = 8 WT and n = 8 CF littermates. Error bars show the mean. Note that arachidonic acid (C20:4) uniquely shows greater uptake by CF lung compared with WT lung. *P < 0.05, by paired, 2-tailed Student’s t test. (C) Arachidonic acid (C20:4) trafficking. Bars show the mean for 8 WT and 8 CF littermates. *P < 0.05, by paired, 2-tailed Student’s t test. (D) Calculated ratio of lung uptake of arachidonic acid versus docosahexaenoic acid. Bars show the mean. *P < 0.05, by Wilcoxon signed-rank test. n = 8 WT and n = 8 CF littermates. (E) Glutamate and glutamine trafficking between the liver and leg. Bars show the mean ± SD for 8 WT and 8 CF littermates, except glutamine WT liver (n = 7). *P < 0.05 and ***P < 0.001, by 1-sample t test or Mann-Whitney U test (see also Supplemental Table 2). (F and G) Hepatic and renal glucose trafficking. Bars show the mean. n = 8 WT and n = 8 CF littermates. **P < 0.01, by Wilcoxon signed-rank test.

