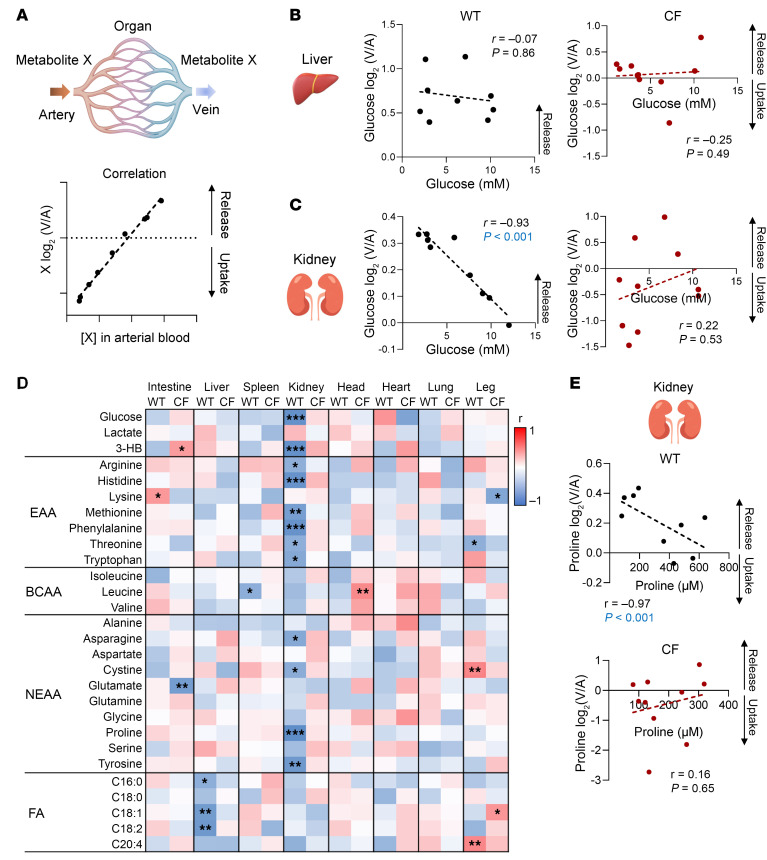
Figure 4. Loss of CFTR disrupts renal glucose and amino acid homeostasis.
(A) Schematic of correlation analysis of circulating metabolites between arterial concentration, [X], and tissue release/uptake activity [log2(V/A)]. For correlation analysis in the liver, the weighted average of portal and arterial blood concentration was used. (B and C) Correlations between blood glucose concentration and hepatic or renal release in WT and CF pigs. P values were calculated by Spearman’s correlation test. n = 9 WT and n = 10 CF pigs. (D) Heatmap showing correlations for 28 abundant metabolites across 8 organs. EAA, essential amino acids; BCAA, branched-chain amino acids; NEAA, nonessential amino acids. *P < 0.05, **P < 0.01, and ***P < 0.001, by Spearman’s correlation test. n = 9 WT and n = 10 CF pigs. (E) Correlations between arterial blood concentrations and kidney trafficking of proline in WT and CF pigs. P values were calculated by Spearman’s correlation test. n = 9 WT and n = 10 CF pigs.

