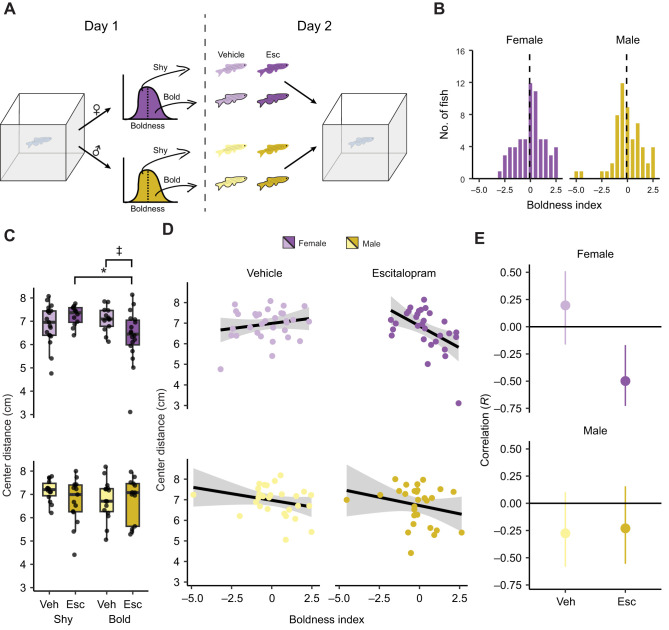
Fig. 3.
The effect of escitalopram on the exploratory behavior of bold and shy fish. (A) Fish were separated into bold and shy animals based on a median split of their boldness index during an initial exposure to the tank (day 1). On day 2, fish were given either vehicle (Veh) or 1 mg kg−1 escitalopram (Esc) prior to being placed back into the novel tank. (B) Histogram of boldness index on day 1 of exposure to the novel tank. The dashed line is the median. (C) Center distance on day 2 in female (top) and male (bottom) animals given either vehicle or escitalopram. Boxplot center is the median, hinges are interquartile ranges and whiskers are the hinge ±1.5 times the interquartile range. (D) Scatterplots and regression lines for boldness index on day 1 and center distance on day 2 for female and male fish given vehicle or escitalopram. (E) Pearson's correlations and 95% confidence intervals (error bars) corresponding to scatterplots in D. ‡P<0.10, *P<0.05 from false discovery rate (FDR)-corrected post hoc t-tests. Shy female: n=19 vehicle, n=12 escitalopram; bold female: n=13 vehicle, n=18 escitalopram; shy male: n=14 vehicle, n=15 escitalopram; bold male: n=15 vehicle, n=13 escitalopram.

