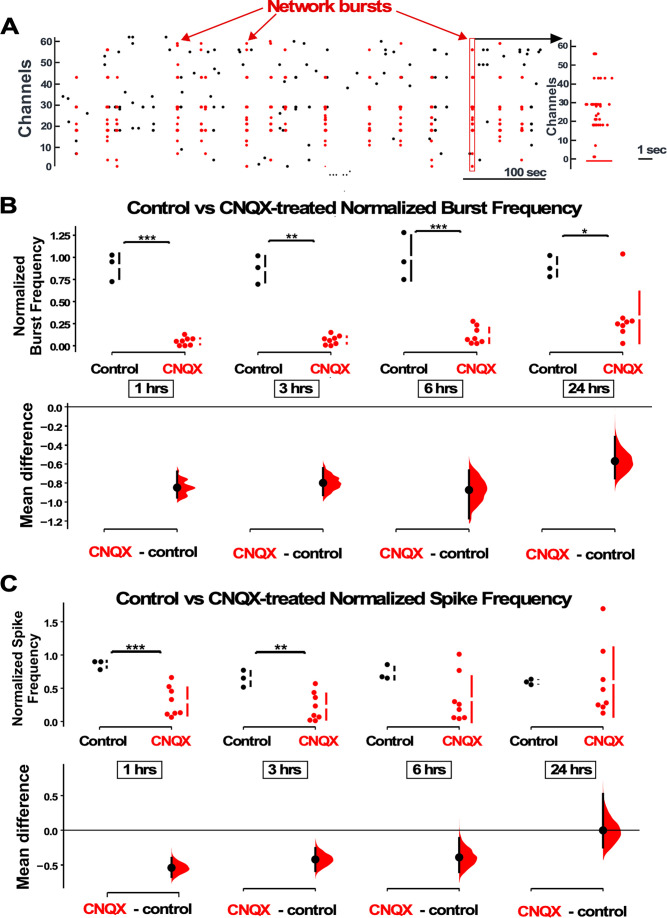
Figure 1. AMPAergic blockade reduces burst frequency and overall spike rate.
(A) Network bursts can be identified by detected spikes (red dots) time-locked in multiple channels of the multi-electrode array (MEA) (Y axis). One burst (red rectangle) is expanded in time and shown in the raster plot on the right. (B) The normalized burst rate is shown in control cultures and following application of CNQX for 24 hr. (C) Average overall spike frequency is compared for CNQX-treated cultures and control unstimulated cultures at 1 hr, 3 hr, 6 hr (p=0.104), and 24 hr (p=0.982) after addition of CNQX or vehicle. The mean differences at different time points are compared to control and displayed in Cumming estimation plots. Significant differences denoted by *p≤0.05, **p≤0.01, ***p≤0.001. Recordings from single cultures (filled circles, control n=3 cultures, CNQX n=8 cultures), where mean values (represented by the gap in the vertical bar) and SD (vertical bars) are plotted on the upper panels. Mean differences between control and treated groups are plotted on the bottom panel, as a bootstrap sampling distribution (mean difference is represented by a filled circles and the 95% CIs are depicted by vertical error bars).


