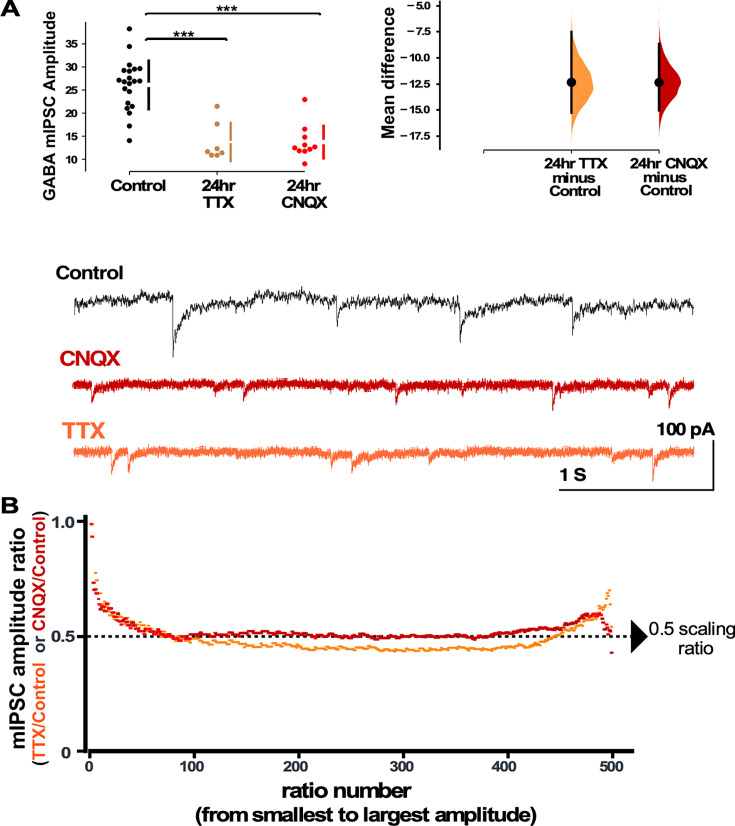
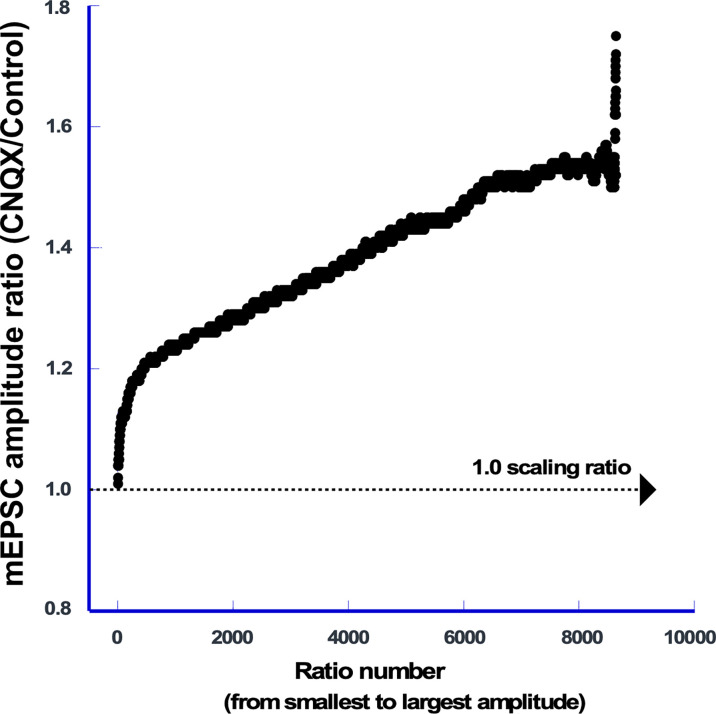
Figure 2. Both activity and AMPA receptor (AMPAR) blockade cause a reduction in miniature inhibitory postsynaptic current (mIPSC) amplitudes that appear to scale down.
(A) CNQX and TTX produce a reduction in average amplitude of mIPSCs as shown in the scatter plots (control - n=21 from 10 cultures, TTX - n=7 from 3 cultures, CNQX - n=10 from 6 cultures). The mean differences are compared to control and displayed in Cumming estimation plots. Significant differences denoted by ***p≤0.001. GABAergic mIPSC amplitudes from single neurons (filled circles), where mean values (represented by the gap in the vertical bar) and SD (vertical bars) are plotted on the panels to the left. Mean differences between control and treated groups are plotted on the panel to the right, as a bootstrap sampling distribution (mean difference is represented by a filled circles and the 95% CIs are depicted by vertical error bars). Example traces showing mIPSCs are shown below. (B) Scaling ratio plots show the relationship of mIPSC amplitudes from treated cultures compared to untreated cultures. All recordings taken from cultured neurons plated on coverslips, not multi-electrode arrays (MEAs).


