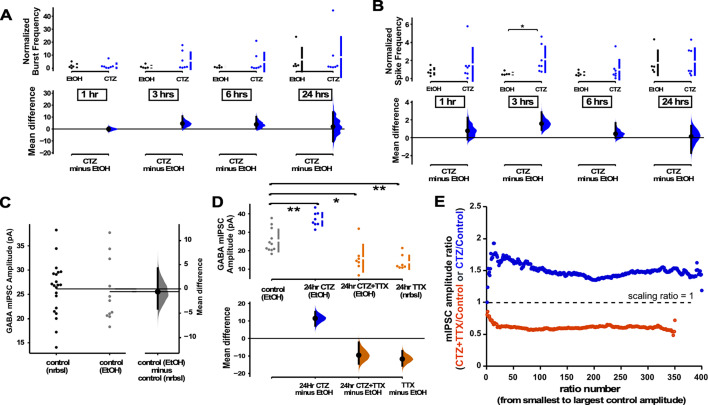
Figure 5. GABAergic upscaling was triggered by cyclothiazide (CTZ) and this was dependent on spiking activity.
(A) Multi-electrode array (MEA) recordings show that CTZ-treated cultures trended toward increases in normalized burst rate compared to control untreated cultures at 1 hr (p=0.97), 3 hr (p=0.246), 6 hr (p=0.397), and 24 hr (p=0.894) after addition of CNQX (n=7) or vehicle (n=5). (B) MEA recordings show that CTZ-treated cultures trended toward increases in normalized overall spike rate compared to control untreated cultures at 1 hr (p=0.565), 3 hr, 6 hr (p=0.634), and 24 hr (p=0.92) after addition of CNQX or vehicle. (C) Control cultures in Neurobasal (nrbsl) were compared with control cultures with ethanol (EtOH) dissolved in Neurobasal (1:1000). Amplitude of miniature inhibitory postsynaptic currents (mIPSCs) in different controls were no different (p=0.803, nrbsl - n=21 from 10 cultures, EtOH - n=11 from 3 cultures). (D) CTZ treatment (dissolved in ethanol) led to an increase in mIPSC amplitude compared to ethanol control cultures (CTZ - n=8 from 3 cultures). CTZ combined with TTX (in ethanol) produced a reduction of mIPSC amplitude compared to controls (ethanol) that was no different than TTX (nrbsl) alone (CTZ + TTX - n=7 from 3 cultures, TTX - n=7 from 3 cultures is same data as shown in Figure 2A). The mean differences at different time points or conditions are compared to control and displayed in Cumming estimation plots. Significant differences denoted by *p≤0.05, **p≤0.01. Recordings from single cultures (filled circles), where mean values (represented by the gap in the vertical bar) and SD (vertical bars) are plotted on the upper panels. Mean differences between control and treated groups are plotted on the bottom panel, as a bootstrap sampling distribution (mean difference is represented by a filled circles and the 95% CIs are depicted by vertical error bars). (E) Scaling ratios show that both CTZ-induced increases and CTZ + TTX-induced decreases were multiplicative. All mIPSC amplitudes recorded from cultures plated on coverslips, not MEAs.

