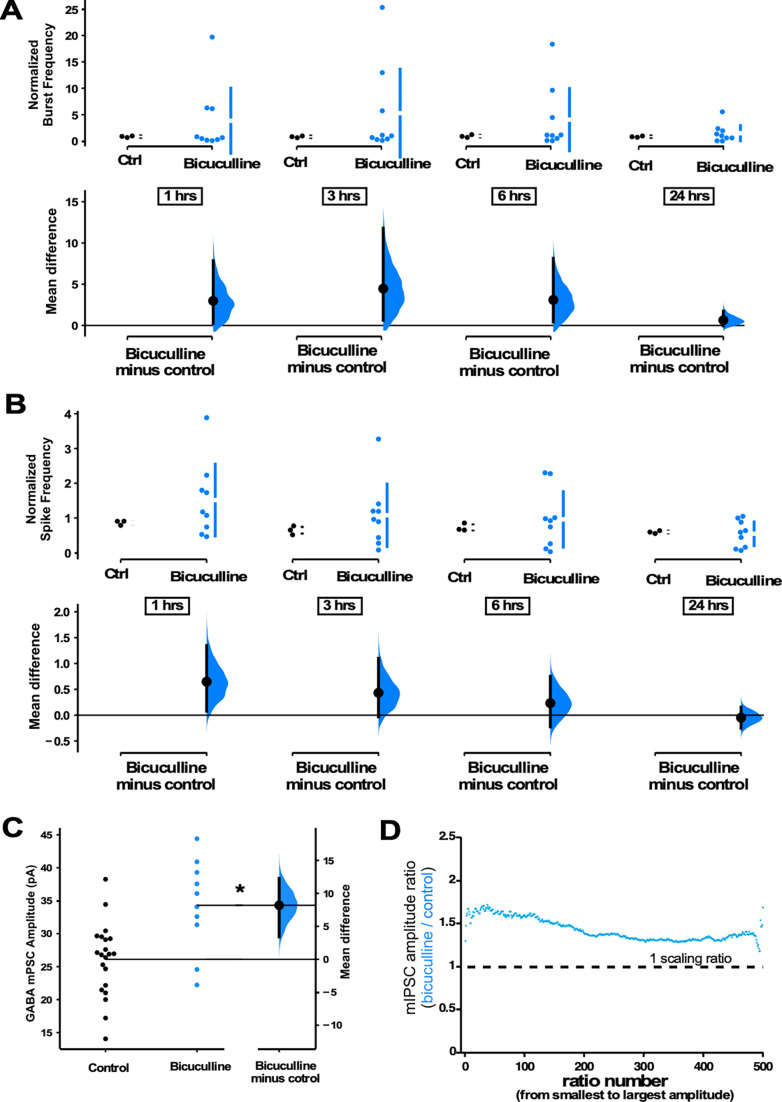
Figure 6. GABAergic upscaling is triggered by increased spiking activity rather than reduced GABAR activation.
(A) Bicuculline-treated cultures (24 hr) plated on multi-electrode arrays (MEAs) trended upward in normalized burst rate compared to control untreated cultures at 1 hr (p=0.63), 3 hr (p=0.556), 6 hr (p=0.547), and 24 hr (p=0.559) after addition of bicuculline (n=9 cultures) or vehicle (n=3 cultures, same data as Figure 1). (B) Bicuculline-treated cultures (24 hr) plated on MEAs trended upward in normalized overall spike frequency compared to control untreated cultures at 1 hr (p=0.358), 3 hr (p=0.462), 6 hr (p=0.734), and 24 hr (p=0.772) after addition of bicuculline or vehicle. Recordings from single cultures (filled circles), where mean values (represented by the gap in the vertical bar) and SD (vertical bars) are plotted on the upper panels. (C) Bicuculline treatment (24 hr) produced an increase in miniature inhibitory postsynaptic current (mIPSC) amplitudes (control - n=21 from 10 cultures, bicuculline - n=10 from 4 cultures). The mean difference is compared to control and displayed in Cumming estimation plots. Significant difference denoted by *p≤0.05. Recordings from single neurons (filled circles), and mean values (represented by the horizontal line). Control and treated group is plotted, as a bootstrap sampling distribution (mean difference is represented by a filled circles and the 95% CI is depicted by vertical error bar). (D) Ratio plots for bicuculline-induced increase in mIPSCs exhibit a multiplicative profile. All mIPSC amplitudes recorded from cultures plated on coverslips, not MEAs.


