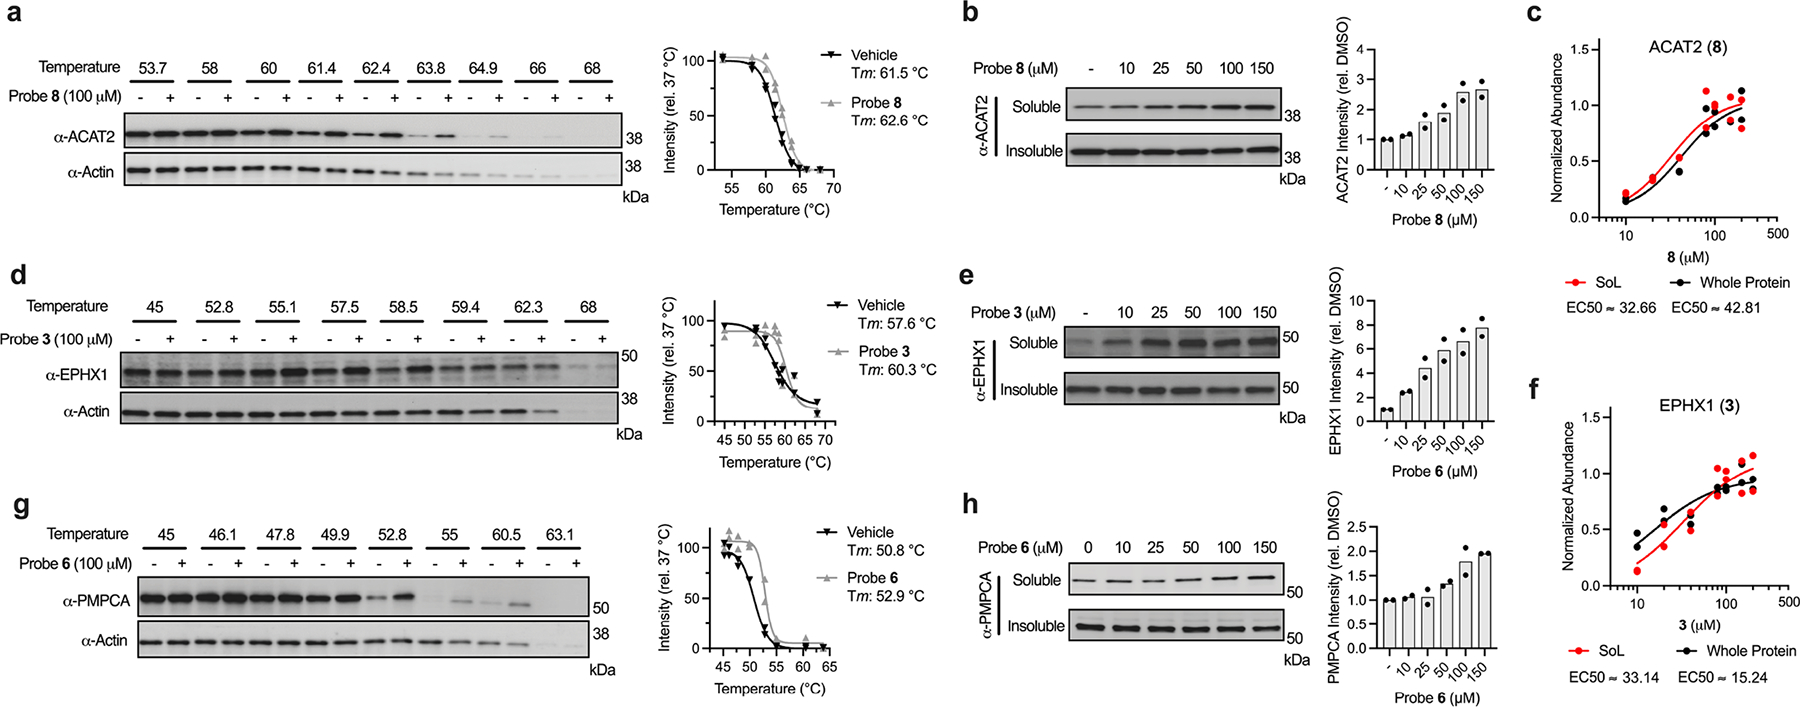
Extended Data Fig. 6. Extended orthogonal validation of probe-target interactions.

(a) Cellular thermal shift assay (CETSA) temperature gradient and quantification of probe 8-ACAT2 interaction. (b) CETSA dose analysis of probe 8-ACAT2 interaction. (c) Probe 8-ACAT2 concentration plot from proteomics experiment. (d) CETSA temperature gradient and quantification of probe 3-EPHX1 interaction. (e) CETSA dose analysis of probe 3-EPHX1 interaction. (f) Probe 3-EPHX1 concentration plot from proteomics experiment. (g) CETSA temperature gradient and quantification of probe 6-PMPCA interaction. (h) CETSA dose analysis of probe 6-PMPCA interaction. Each immunoblot displayed is representative of two independent experiments.
