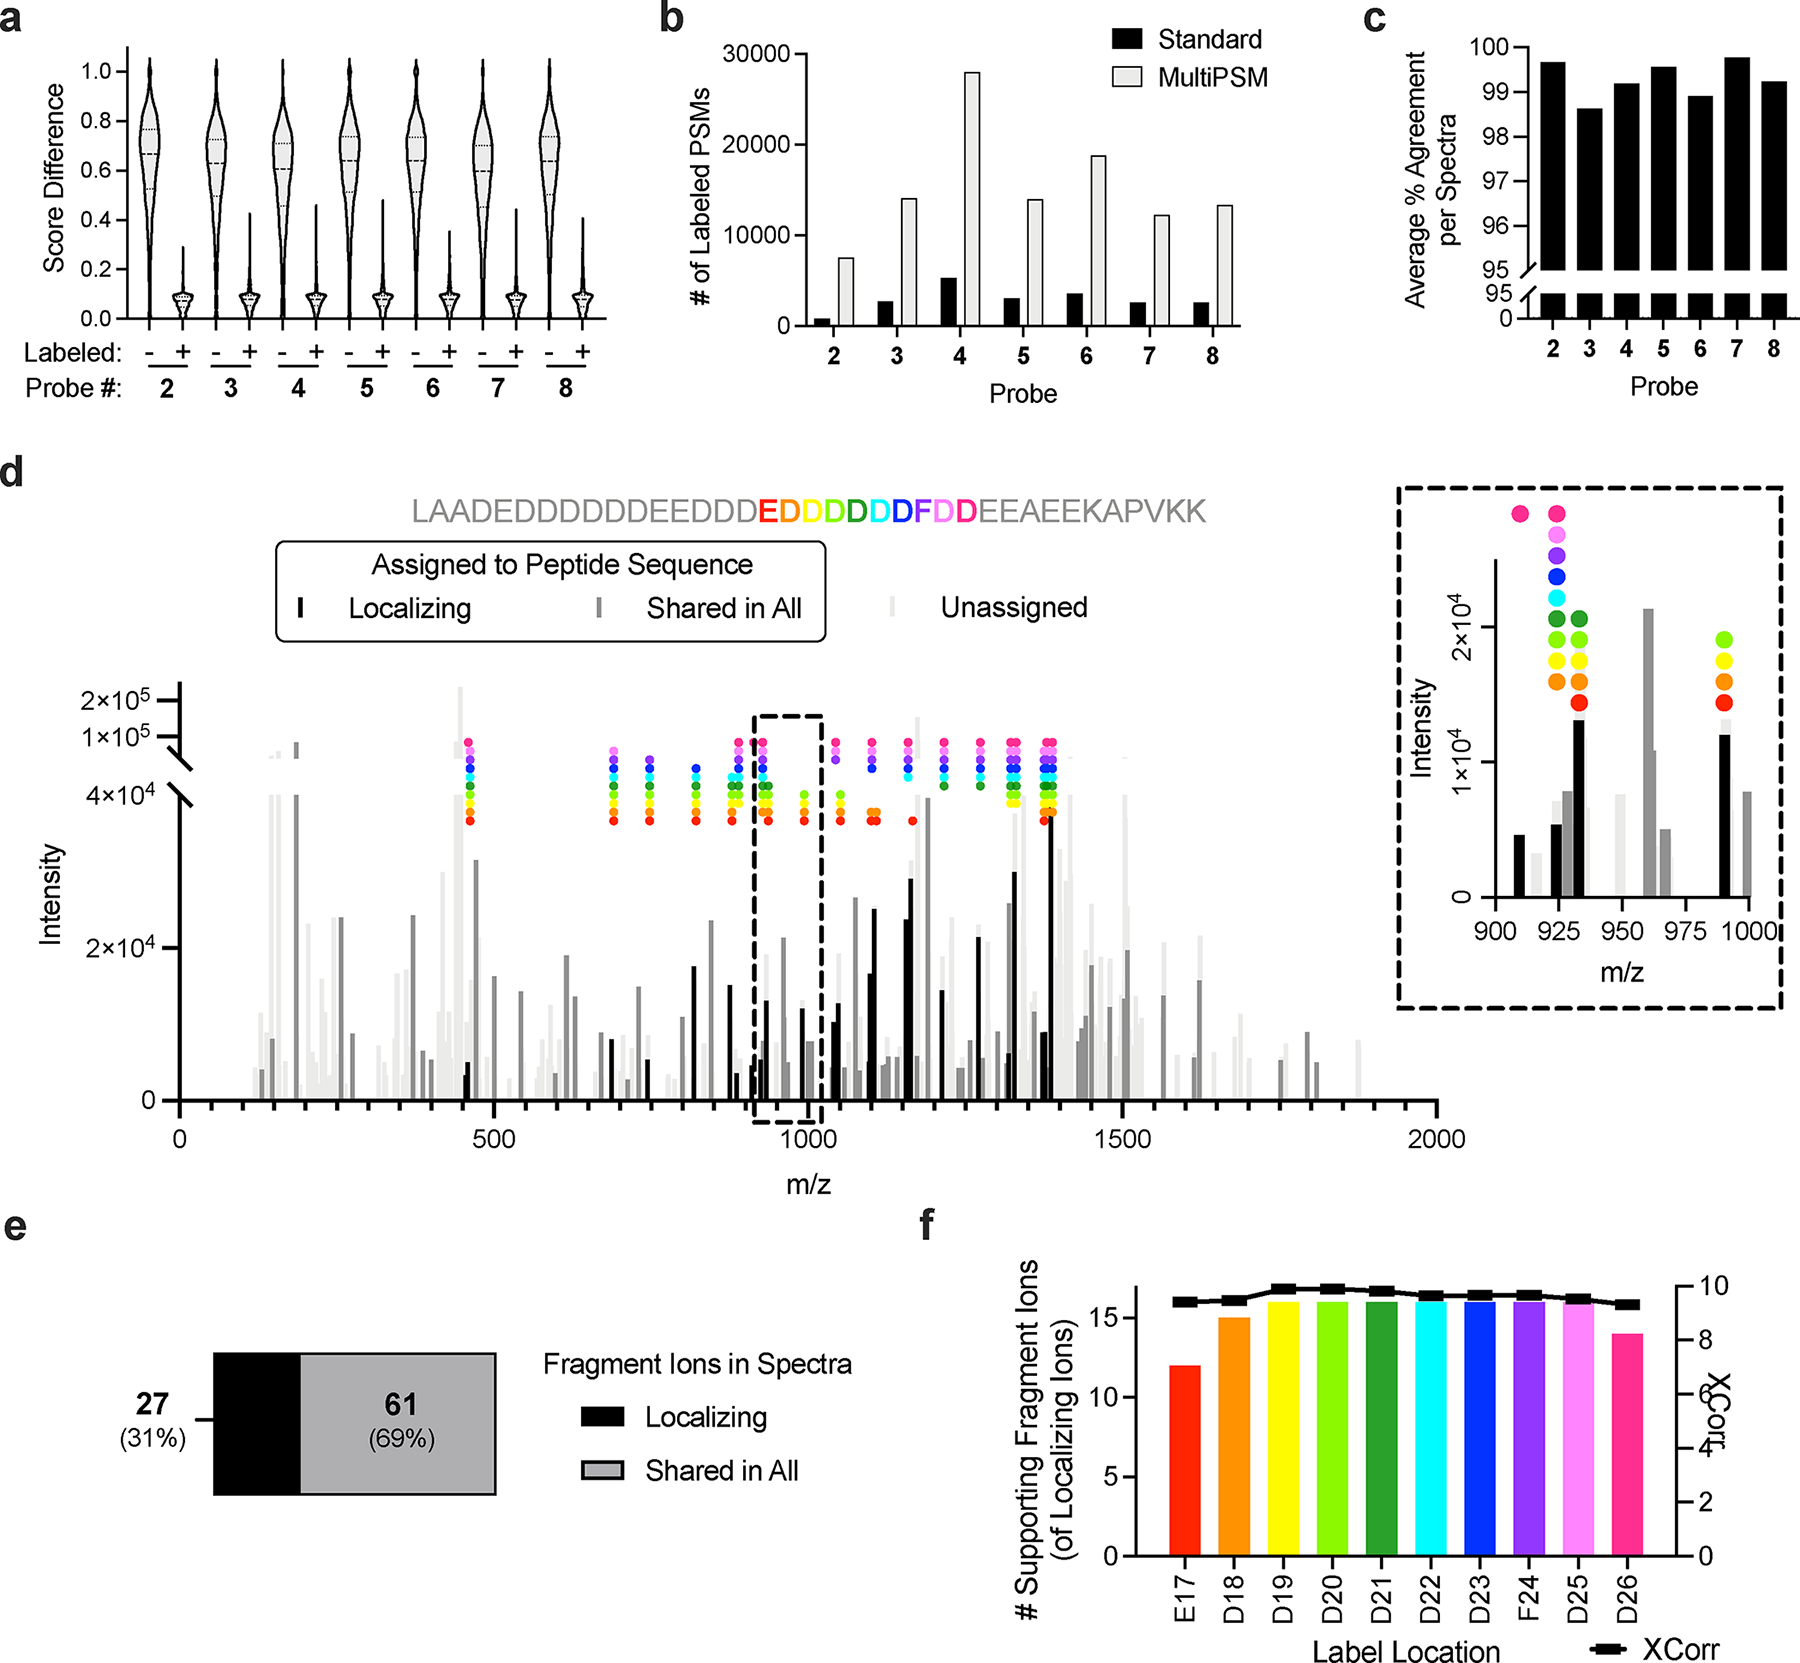
Figure 2.

Photoaffinity probe labeled peptides generate chimeric spectra. (a) Score differences between first and second ranked PSMs for spectra assigned to labeled and unlabeled peptides. (b) Labeled PSMs detected in standard and multiPSM proteomic searches. (c) Sequence agreement of peptides assigned to same spectra in multiPSM proteomic searches. (d) Example of a highly chimeric spectra containing at least ten label sites. Probe label sites and corresponding supporting fragment ions are indicated with identical colors. Inset shows zoomed region of 900 – 1000 m/z. (e) Proportion of fragment ions in chimeric spectra that correspond to a particular probe location or are shared in all locations. (f) Number of supporting fragment ions and XCorr values for each label location within the example chimeric spectra.
