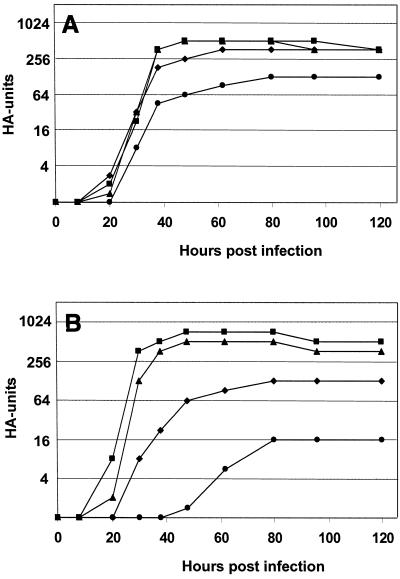
FIG. 4.
Growth curves of recombinants in MDCK cells. Cell monolayers were infected at an MOI of 0.001 with recombinant viruses, and supernatants were monitored for HA titers at the time points indicated. (A) Viruses of the N2 series. (B) Viruses of the N1 series. ■, wild type; ▴, G1; ⧫, G2; ●, G1,2.

