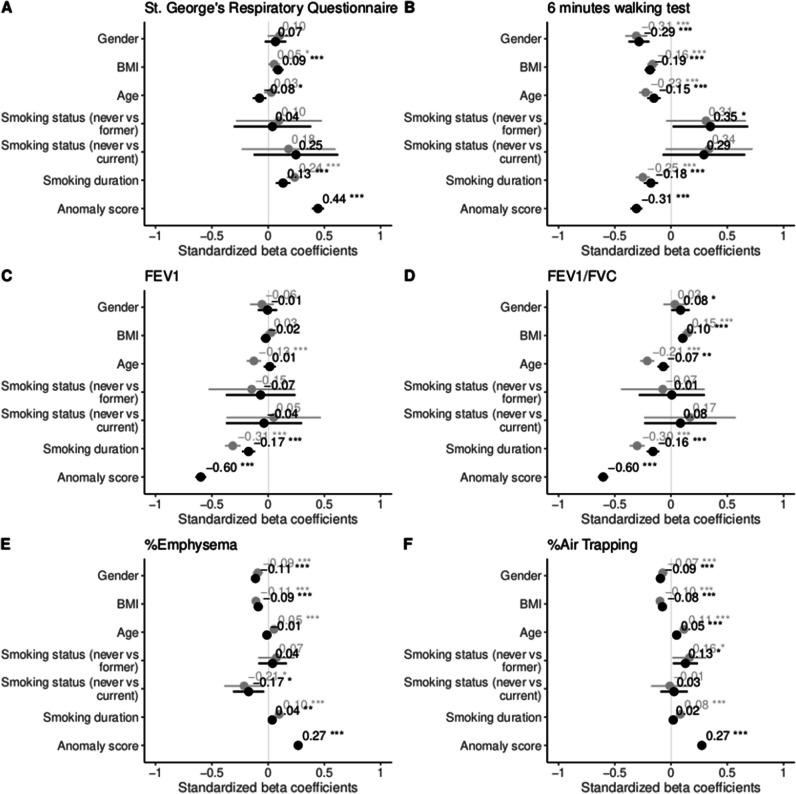
Fig. 5.
COPDGene forest plots of standardized beta values of the linear mixed effects models to predict the St. George’s Respiratory Questionnaire (A), 6-min walking test (B), FEV1 (C), FEV1/FVC (D), %Emphysema (E), and %Air Trapping (F). %Emphysema and %Air Trapping were skewed, so a log transformation was applied. Baseline models (without the anomaly score) are colored in gray, while baseline + anomaly score models are colored in black (p < 0.05*/0.01**/0.001***). BMI, body mass index; FEV1, forced expiratory volume in 1 s; FEV1/FVC, FEV1-to-forced vital capacity ratio

