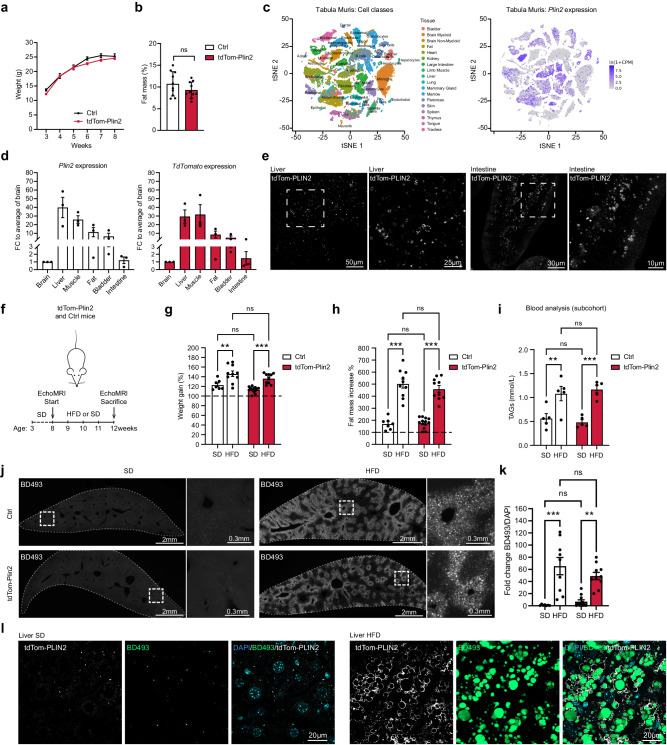
Fig. 2. TdTom-Plin2 mice report LDs in several organs and increase both fat mass and LDs in the liver upon a short-term high fat diet.
a There is no major difference in body weight gain over time between Ctrl and tdTom-Plin2 mice in the span of 3- to 8 weeks of age. (n = 10 mice per group, mean +/- SEM). b Assessment of body fat composition at 8 weeks using EchoMRI shows no significant difference between Ctrl and tdTom-Plin2 mice. (n = 10 mice per group, mean +/- SEM). c Plin2 is expressed in many tissues such as liver, lung, and heart, as shown by a query of the Tabula muris37. d Plin2 and tdTomato are expressed in many organs in the tdTom-Plin2 mouse (n = 3 mice, mean +/- SEM). e Representative images of the tdTomato signal from the liver and the intestine of a tdTom-Plin2 mouse confirm the presence of fluorescently labeled LDs in these organs. f Overview of the 4 week high fat diet (HFD) exposure. g Both tdTom-Plin2 and Ctrl mice had a significant increase in body weight after 4 weeks of HFD compared to standard diet (SD). (n = 7 Ctrl SD, 10 Ctrl HFD, 13 tdTom-Plin2 SD, 10 tdTom-Plin2 HFD mice, mean +/- SEM). h Both tdTom-Plin2 and Ctrl mice had a significant increase in fat mass after 4 weeks of HFD compared to SD. (n = : 7 Ctrl SD, 10 Ctrl HFD, 13 tdTom-Plin2 SD, 10 tdTom-Plin2 HFD mice, mean +/- SEM). i Serum levels of TAGs were significantly increased in HFD fed animals compared to SD in both tdTom-Plin2 and Ctrl mice. (n = 5 mice per group, mean +/- SEM). j Representative images of liver sections (single-plane overview and high magnification) stained with BODIPY 493/503 (BD493) of Ctrl and tdTom-Plin2 mice fed a SD or HFD. k Quantification of the LD accumulation in the liver, shown in J. Both Ctrl and tdTom-Plin2 mice have a significant increase in LDs upon HFD (BD493 area/DAPI). (n = 7 Ctrl SD, 11 tdTom-Plin2 SD, 9 Ctrl HFD and 10 tdTom-Plin2 HFD mice, mean +/- SEM). l tdTom-PLIN2 signal also increased significantly in tdTom-Plin2 mice fed a HFD compared to tdTom-Plin2 mice fed a SD, with the tdTomato signal mostly surrounding the BD493 signal. Shown are representative high magnification single plane confocal images. Asterisks indicate the following p-values: * < 0.05; ** < 0.01; *** < 0.001. ns = non-significant.

