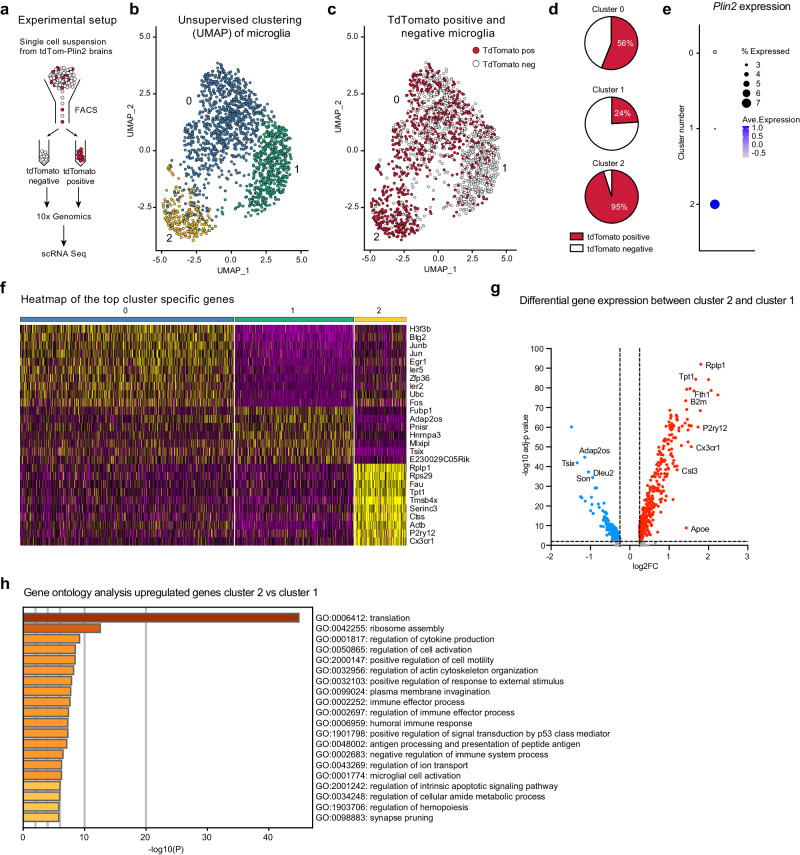
Fig. 4. ScRNA sequencing of tdTomato-PLIN2 positive microglia reveals a subpopulation with a specific signature under physiological conditions.
a Schematic illustration of the experimental setup. b Unsupervised clustering of cells with microglial identity reveals three distinct clusters. c The three microglial clusters contain distinct proportions of tdTomato positive cells. d Quantification of tdTomato-PLIN2 positive and negative cells per cluster identifies cluster 2 as highly enriched for microglia containing LDs, while cluster 1 contains a majority of tdTomato negative cells. e The Plin2 expression matches this distribution, validating the sorting approach. f A heatmap of the top cluster specific genes shows a clear separation of the tdTomato-PLIN2 positive cluster 2, whereas cluster 1 and 0 had a less striking difference in gene expression. g Volcano plot of differentially expressed genes between cluster 2 and cluster 1. h A gene ontology (GO) analysis of the upregulated genes in cluster 2 reveals the enrichment of several terms involved in cellular activation as well as in immune functions.

