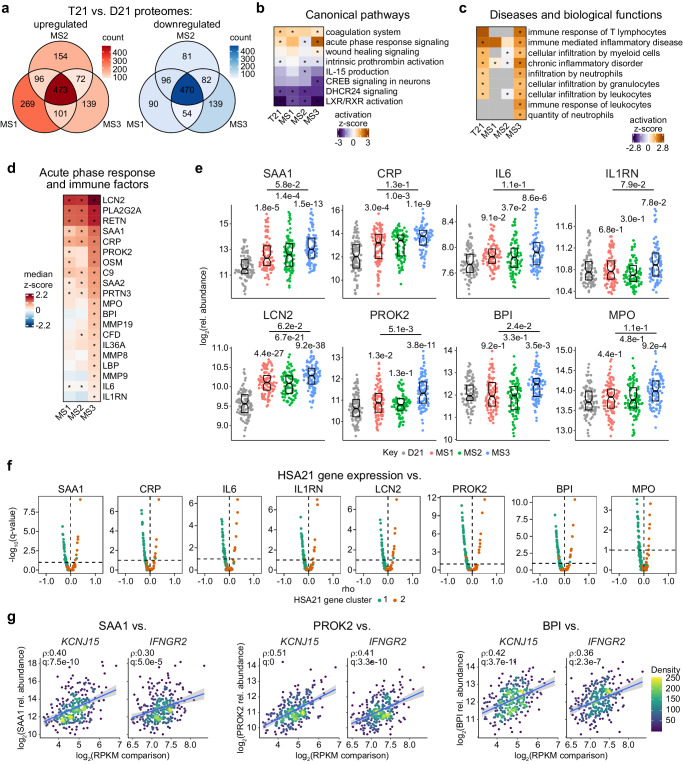
Fig. 4. Plasma proteomics reveals varied immune and inflammatory dysregulation across subtypes.
a Diagrams show overlapping differentially abundant proteins identified by linear regressions in comparisons of each molecular subtype (MS1, n = 107; MS2, n = 95; MS3, n = 102) against euploid controls (D21, n = 103). b, c Heatmaps showing select canonical pathways (b) and disease and biological functions (c) from Ingenuity Pathway Analysis (IPA) of linear regression results comparing trisomy 21 (T21, n = 304), MS1 (n = 107), MS2 (n = 95) and MS3 (n = 102) to D21 (n = 103), with asterisks denoting q < 0.1 from IPA overrepresentation analysis d Heatmap showing median z-scores relative to euploid controls (D21, n = 103) for representative inflammatory and immune-related proteins in MS1 (n = 107), MS2 (n = 95), and MS3 (n = 102). Asterisks indicate significance (q < 0.1) from linear regressions vs. D21 after Benjamini–Hochberg adjustment for multiple hypotheses. e Sina plots showing levels of example proteins from (d) in D21 (n = 103, gray), MS1 (n = 107, red), MS2 (n = 95, green), and MS3 (n = 102, blue). q-values, derived from linear regressions and adjusted using the Benjamini–Hochberg method, are displayed above individual data swarms for comparisons to D21 and above lines for MS3 vs. MS1. Boxes represent interquartile ranges and medians, with notches approximating 95% confidence intervals. f Volcano plots showing Spearman correlations of proteins from (e) vs. mRNA expression of HSA21 cluster 1 genes (teal) and HSA21 cluster 2 genes (orange) in individuals with T21 (n = 304). Dashed line indicates q = 0.1. g Scatter plots depicting relationships between levels of SAA1, PROK2 and BPI proteins vs. expression of HSA21 cluster 2 genes KCNJ15 and IFNGR2 in individuals with T21 (n = 304). rho and q-values (Benjamini–Hochberg adjusted p-values) for Spearman correlation are denoted. Points are colored by density; blue lines represent the fitted values from linear regressions, with 95% confidence intervals in grey.

