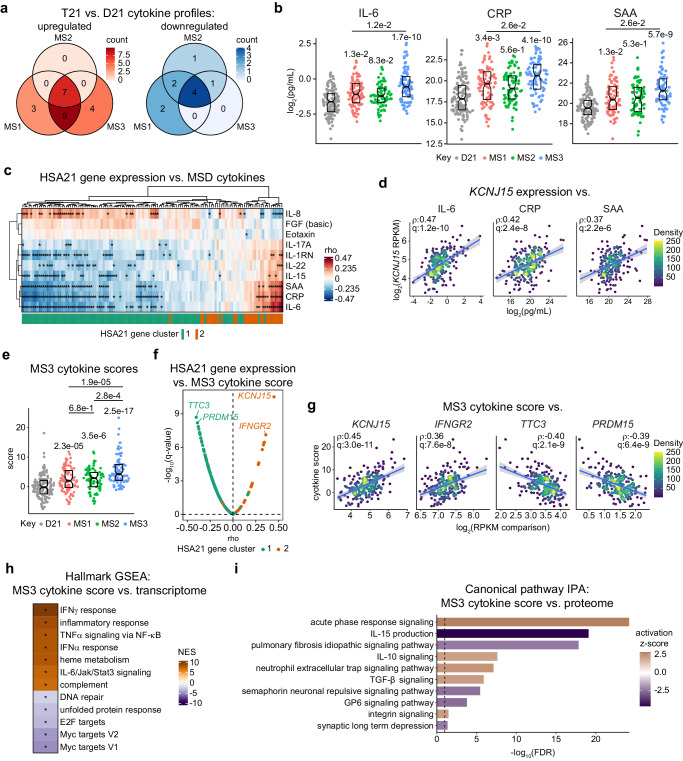
Fig. 5. Molecular subtypes associate with distinct inflammatory milieus.
a Overlapping differentially abundant inflammatory markers identified by linear regressions comparing each molecular subtype (MS1, n = 87; MS2, n = 75; MS3, n = 87) against euploid controls (D21, n = 131). b Sina plots for IL-6, CRP, and SAA in D21 (n = 131, gray), MS1 (n = 87, red), MS2 (n = 75, green), and MS3 (n = 87, blue). q-values (Benjamini–Hochberg adjusted p-values), derived from linear regressions are displayed above swarms for comparisons to D21 and above lines for MS3 vs. MS1. Boxes represent interquartile ranges (IQR) and medians, notches approximate 95% confidence intervals. c Clustering of Spearman correlations between HSA21 gene expression vs. inflammatory markers. Asterisks indicate q < 0.1 after Benjamini–Hochberg adjustment. Colors indicate HSA21 gene cluster 1 (teal) and 2 (orange). d Scatter plots depicting expression of KCNJ15 vs. IL-6, CRP, and SAA in T21 (n = 249). rho and q-values (Benjamini–Hochberg adjusted p-values) for Spearman correlations are denoted. Points are colored by density; blue lines represent the fitted values from linear regressions, with 95% confidence intervals in grey. e Cytokine scores in D21 (n = 131, gray), MS1 (n = 87, red), MS2 (n = 75, green) and MS3 (n = 87, blue). q-values (Benjamini–Hochberg adjusted p-values), derived from linear regressions are displayed above swarms for comparisons to D21. q-values over lines indicate comparisons between MS. Boxes represent IQRs and medians, notches approximate 95% confidence intervals. f Volcano plot showing Spearman correlations between cytokine scores vs. HSA21 gene expression in T21 (n = 249). Colors indicate HSA21 gene cluster 1 (teal) and 2 (orange). Dashed line indicates q = 0.1. g Scatter plots depicting examples from (f). rho and q-values (Benjamini–Hochberg adjusted p-values) for Spearman correlation are denoted. Points are colored by density; blue lines represent the fitted values from linear regressions, with 95% confidence intervals in grey. h Heatmap showing results from gene set enrichment analysis (GSEA) of correlations between cytokine scores and all mRNAs, with asterisks indicating q < 0.1 after Benjamini–Hochberg adjustment. i Results from canonical pathway Ingenuity Pathway Analysis (IPA) of correlations between cytokine scores and plasma proteins.

