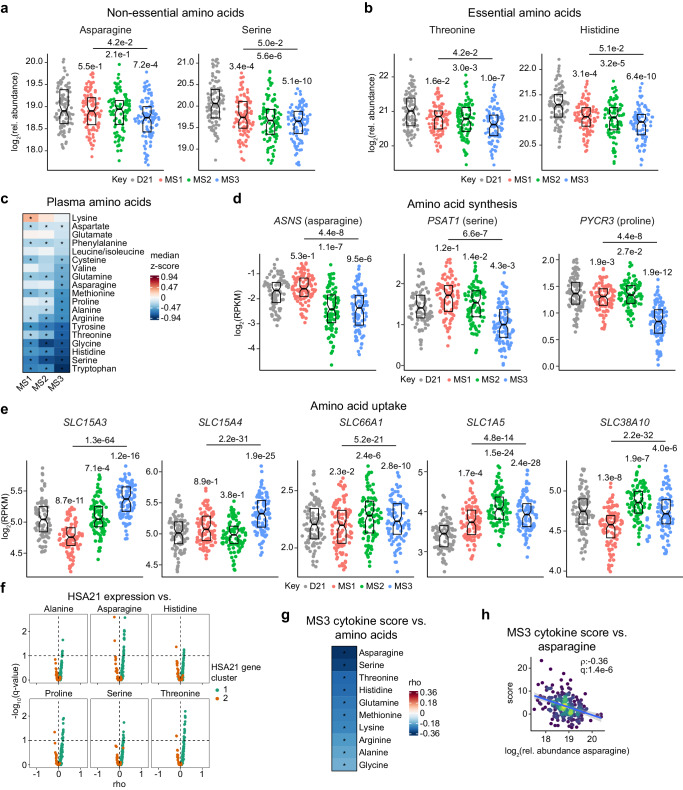
Fig. 6. Plasma metabolomics reveals depletion of amino acids associates with MS3.
a, b Sina plots showing levels of non-essential amino acids (a) and essential amino acids (b) in MS1 (n = 107, red), MS2 (n = 95, green), and MS3 (n = 102, blue) relative to euploid controls (D21, n = 103, gray). q-values, derived from linear regressions and adjusted using the Benjamini–Hochberg method, are displayed above individual data swarms for comparisons to D21 and above lines for MS3 vs. MS1. Boxes represent interquartile ranges and medians, with notches approximating 95% confidence intervals. c Heatmap showing median z-scores relative to euploid controls (D21, n = 103) of all amino acids in metabolome dataset across MS1 (n = 107), MS2 (n = 95), and MS3 (n = 102). Asterisks indicate significance (q < 0.1) from linear regressions vs. D21 after Benjamini–Hochberg adjustment for multiple hypotheses. d, e Sina plots showing mRNA expression of enzymes related to non-essential amino acid biosynthesis (d) and tissue uptake (e) in D21 (n = 103, gray), MS1 (n = 107, red), MS2 (n = 95, green), MS3 (n = 102, blue). q-values, derived from DESeq2 and adjusted using the Benjamini–Hochberg method, are displayed above individual data swarms for comparisons to D21 and above lines for MS3 vs. MS1. Boxes represent interquartile ranges and medians, with notches approximating 95% confidence intervals. f Volcano plots showing Spearman correlations between levels of amino acids vs. expression of HSA21 cluster 1 (teal) and HSA21 cluster 2 (orange) genes in individuals with T21 (n = 304). Dashed line indicates q = 0.1. g Heatmap showing Spearman correlations between cytokine scores and levels of amino acids. Asterisks indicate significance (q < 0.1) after Benjamini–Hochberg adjustment for multiple hypotheses. h Scatter plots depicting relationship between cytokine scores vs. asparagine levels in individuals with T21 (n = 304). rho and q-values (Benjamini–Hochberg adjusted p-values) for Spearman correlation are denoted. Points are colored by density; blue lines represent the fitted values from linear regressions, with 95% confidence intervals in grey.

