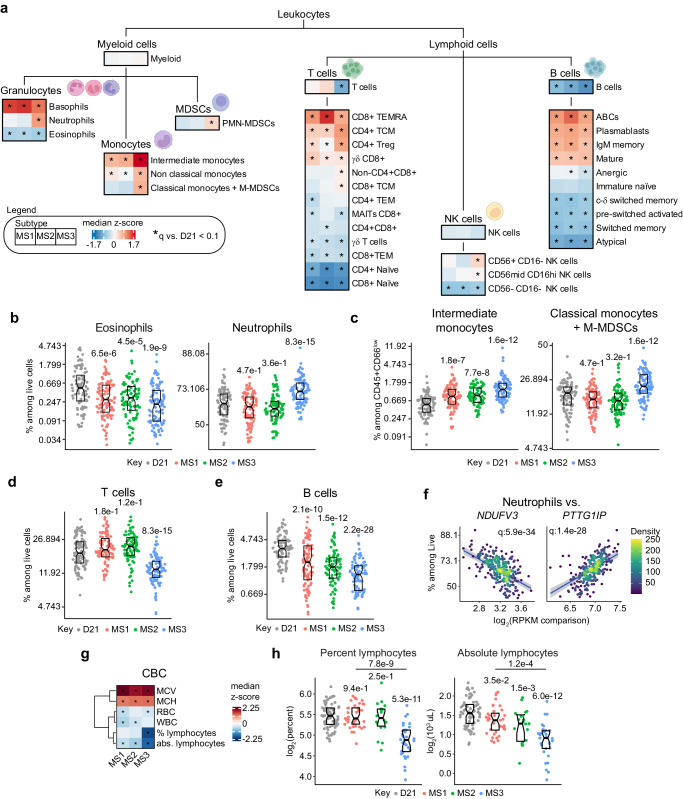
Fig. 7. The molecular subtypes of Down syndrome present unique immune cell landscapes.
a Illustration of immune cell differentiation and heatmaps comparing levels of individual immune cell types in MS1 (n = 98), MS2 (n = 90), MS3 (n = 96). Values are median z-scores relative to euploid controls (D21, n = 96). Asterisks indicate significance (q < 0.1) from beta regressions vs. D21 after Benjamini–Hochberg adjustment for multiple hypotheses. b–e Sina plots showing levels of eosinophils and neutrophils (b), intermediate monocytes and classical monocytes (c), T cells (d), and B cells (e) in MS1 (n = 98, red), MS2 (n = 90, green), MS3 (n = 96, blue) compared to euploid controls (D21, n = 90, gray). q-values, derived from beta regressions and adjusted using the Benjamini–Hochberg method, are displayed above individual data swarms for comparisons to D21. Boxes represent interquartile ranges and medians, with notches approximating 95% confidence intervals. f Scatter plots depicting relationship between neutrophil levels vs. expression of HSA21 cluster 1 gene (NDUFV3) and HSA21 cluster 2 gene (PTTG1IP). Points are colored by density; blue lines represent the fitted values from beta regressions, with 95% confidence intervals in grey. Significance is defined as q < 0.1 after multiple hypothesis correction using the Benjamini–Hochberg method. g Heatmap showing levels of complete blood count (CBC) parameters in MS1 (n = 39), MS2 (n = 19), MS3 (n = 33). Values are median z-scores relative to euploid controls (D21, n = 70). Asterisks indicate significance (q < 0.1) from linear regressions vs. D21 after Benjamini–Hochberg adjustment for multiple hypotheses. h Sina plots showing levels for lymphocyte percentage and absolute lymphocytes in MS1 (n = 39, red), MS2 (n = 19, green), MS3 (n = 33, blue) compared to euploid controls (D21, n = 70, gray). q-values, derived from linear regressions and adjusted using the Benjamini–Hochberg method, are displayed above individual data swarms for comparisons to D21 and above lines for MS3 vs. MS1. Boxes represent interquartile ranges and medians, with notches approximating 95% confidence intervals. Panel a created with graphical elements from BioRender.com released under a Creative Commons Attribution-NonCommercial-NoDerivs 4.0 International license.

