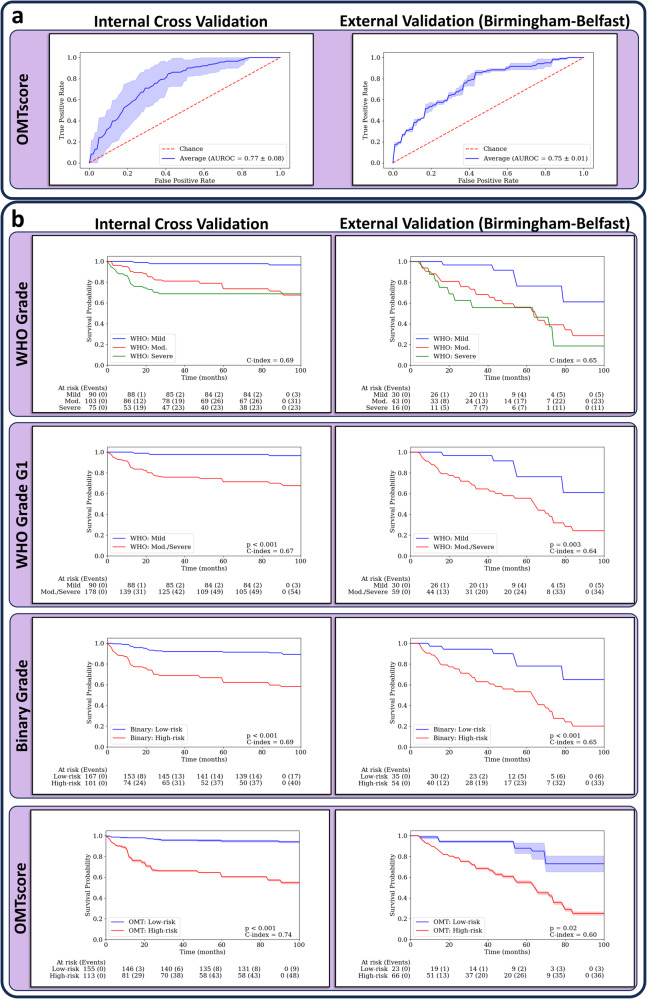
Fig. 2. ROC plots and Kaplan-Meier survival curves for the OMTscore and pathologist grades.
a ROC plots for predicting malignant transformation with internal validation on Sheffield (left), and external validation on the Birmingham-Belfast datasets by our algorithm (right). b Kaplan-Meier transformation-free survival curves based on the internal validation (left) and the external validation set (right) for the predictions from the WHO 2017 grade (top), WHO grade G1 (mild vs. moderate/severe), the binary grade and the OMTscore (bottom). Confidence intervals supplied for the OMTscore output AUROC/Kaplan-Meier curves are generated by the standard deviation of the model output over repeated runs of the experiment.

