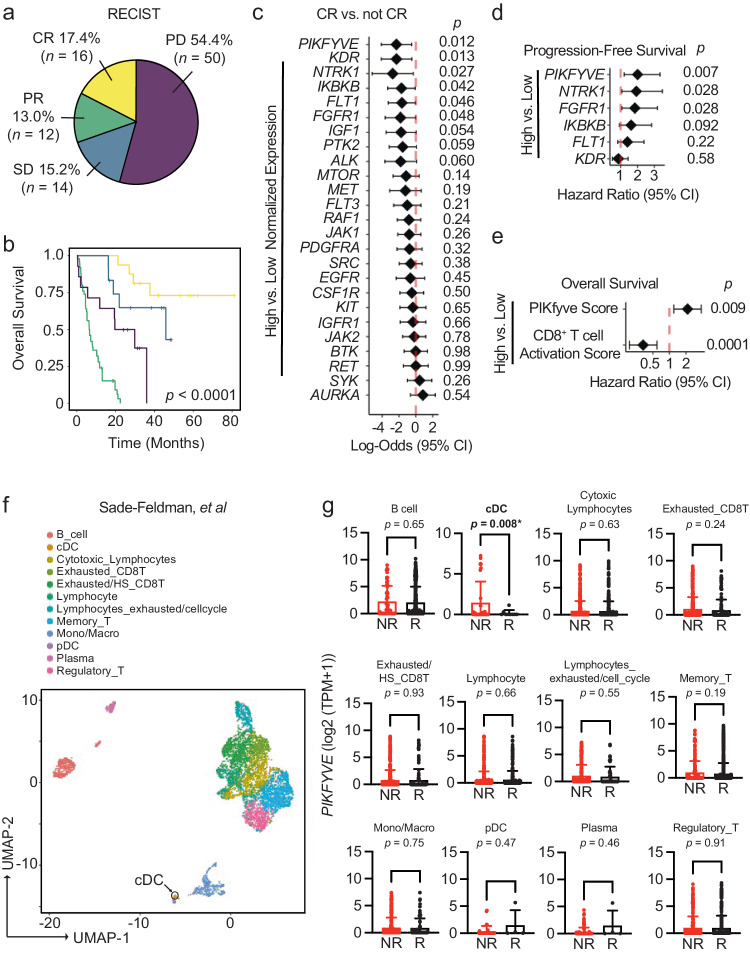
Fig. 1. DC PIKFYVE expression is associated with ICB efficacy.
a Pie chart of number and percentages of RECIST-defined response to treatment of patients treated with immune checkpoint blockade (ICB) at the University of Michigan, Ann Arbor (n = 92). CR complete response, PR partial response, SD stable disease, PD progressive disease. b Kaplan–Meier curves of overall survival of patients treated with ICB, by RECIST-defined treatment response. P value of 3.81 × 10⁻¹³ is determined by log-rank test. c Forest plot of log-odds of having complete response (CR) or not CR for 25 common Phase I/Phase II/FDA-approved drug target genes. Data from bulk RNA-seq from 92 patients are plotted as log-odds with 95% confidence intervals. P values are determined by multivariate logistic regression controlling for cancer type, biopsy, ICB agent, and age at initiation of ICB treatment. d Forest plot of hazard ratios for progression-free survival of patients treated with ICB, by high or low gene expression for candidate drug target genes. Data from bulk RNA-seq hazard ratios with 95% confidence intervals. P values are determined by multivariate cox proportional hazards model controlling for cancer type, ICB agent, and age at initiation of ICB treatment. e Forest plot of hazard ratios for overall survival of patients treated with ICB, by high or low gene expression for PIKfyve score and CD8+ T cell activation score. Data from bulk RNA-seq hazard ratios with 95% confidence intervals. P values are determined by multivariate cox proportional hazards model controlling for cancer type, ICB agent, and age at initiation of ICB treatment. f t-SNE plot of 5928 immune cells in pre-treatment tumors from patients with melanoma from scRNA-seq data49. The black arrow indicates the cDC population. g PIKFYVE expression (log2 (TPM + 1)) across immune cell types in nonresponders (“NR” including SD and PD response) or responders (“R” including PR and CR response) to ICB treatment. Data plotted are mean ± s.d. from scRNA-seq data of 5928 immune cells49. P value determined by student t-test with Welch’s correction. All P values are two-sided without correction for multiple comparisons. Source data are provided as a Source data file.

