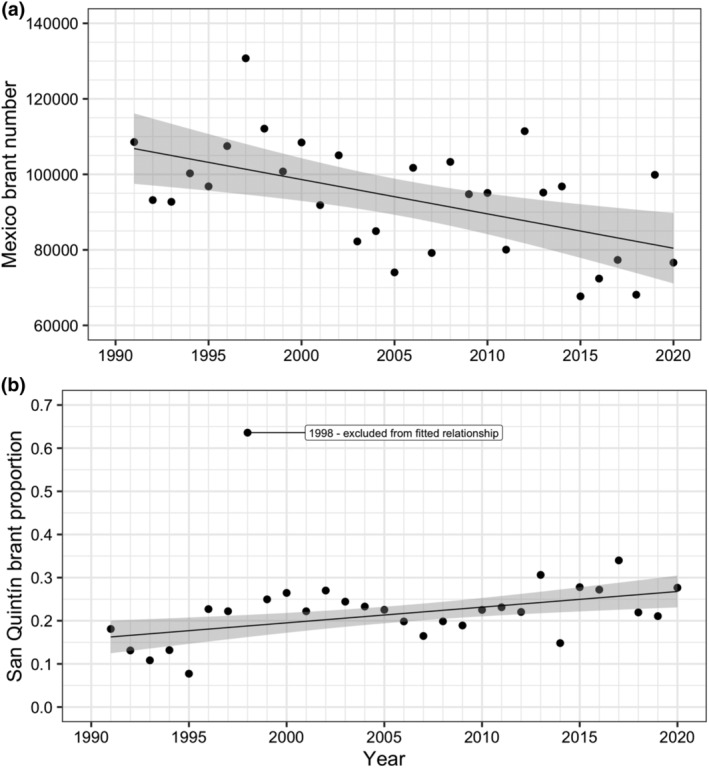
FIGURE 3.

Observed relationships between year and (a) brant population size in Mexico during January and (b) the proportion of Mexico brant population in San Quintín during January 1991–2000. Lines show relationships fitted using linear regression (all years except for brant proportion in 1998) and grey shading indicate 95% confidence interval of fitted relationships.
