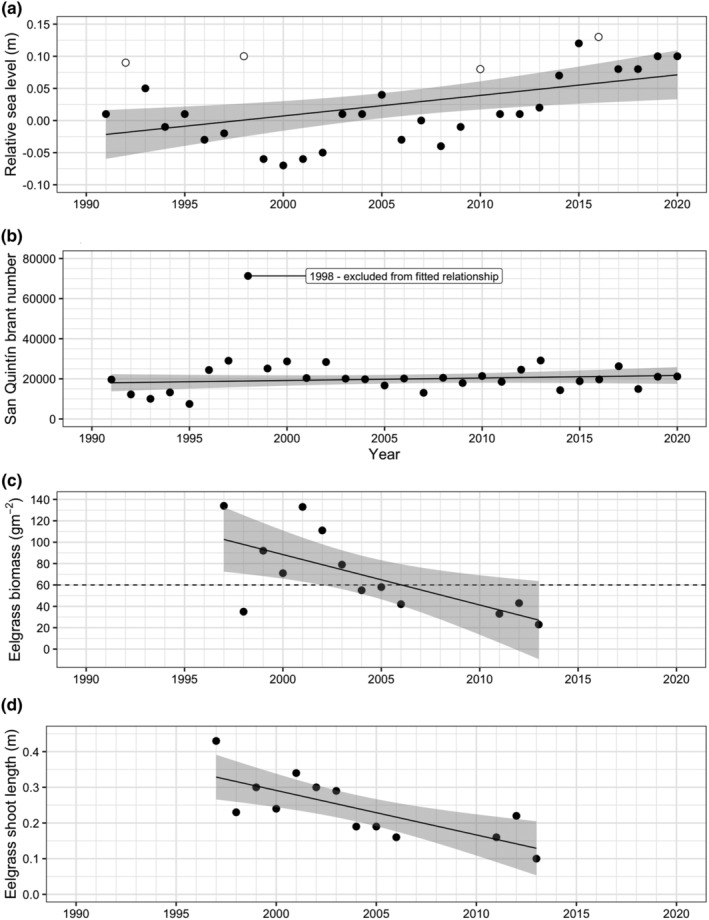
FIGURE 4.

Observed relationships between year and (a) relative sea level (open symbols = years with extreme ENSO events (Multivariate ENSO Index (MEI) Index Scores >1.0)), (b) brant population size, (c) eelgrass biomass, and (d) eelgrass shoot length in Bahía San Quintín during January. Lines show relationships fitted using linear regression (all years except brant numbers in 1998) and gray shading indicate 95% confidence interval of fitted relationships. Horizontal dashed line in (c) indicates an eelgrass biomass of 60 g m−2.
