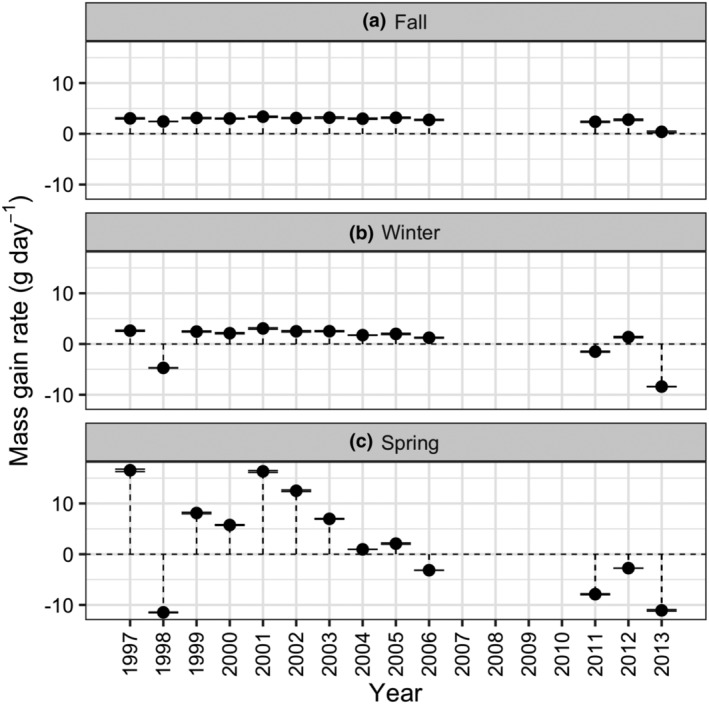
FIGURE 5.

Predicted between‐year variation in the rate of mass gain of brant during (a) fall, (b) winter, and (c) spring. Relative sea level, eelgrass biomass and shoot length, and brant winter population size varied between years, with remaining parameters unchanged. Symbols show mean predictions of five replicate simulations and error bars indicate associated 95% confidence intervals (error bars appear as a single line when 95% confidence intervals are small). The broken horizontal line shows a mass gain of 0 g day−1; symbols above this line show mass gain and symbols below show mass loss.
