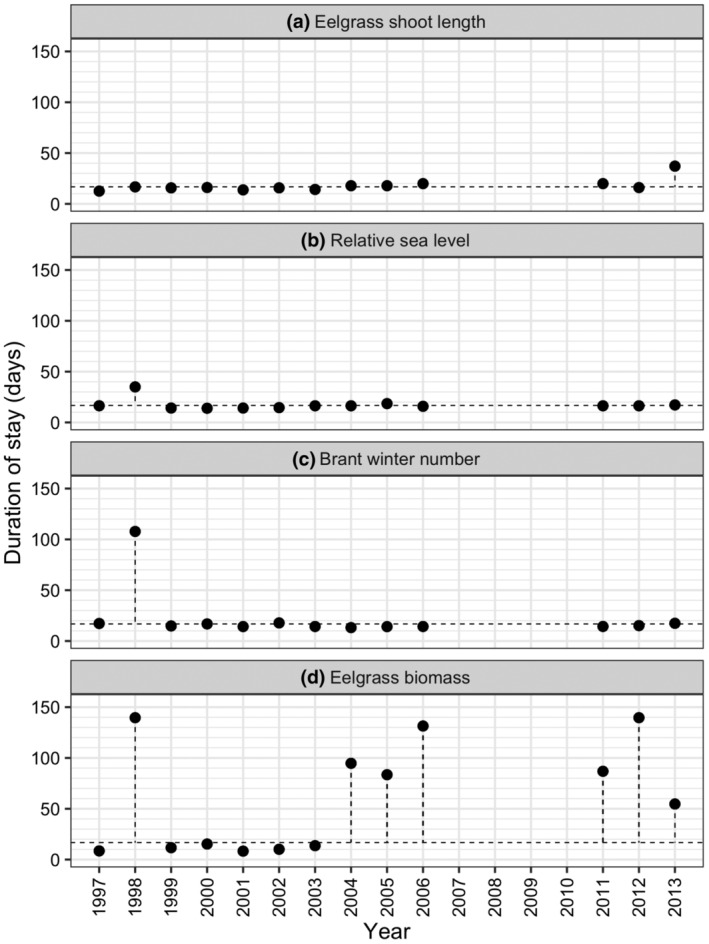
FIGURE 7.

Predicted effect of between‐year variation in single variable simulations of (a) January eelgrass shoot length, (b) relative sea level, (c) brant winter population size, and (d) January eelgrass biomass on predicted duration of stay of spring migrants. Each figure shows year‐specific variability in predictions (solid symbols) of one parameter with values of the remaining three parameters held at their mean value across the years. The broken horizontal line shows the predicted duration of stay of spring migrants with all four parameters held at their mean value. The extent to which symbols deviate from the horizontal line indicates the amount to which the predicted duration of stay was dependent on the year‐specific value of a parameter.
