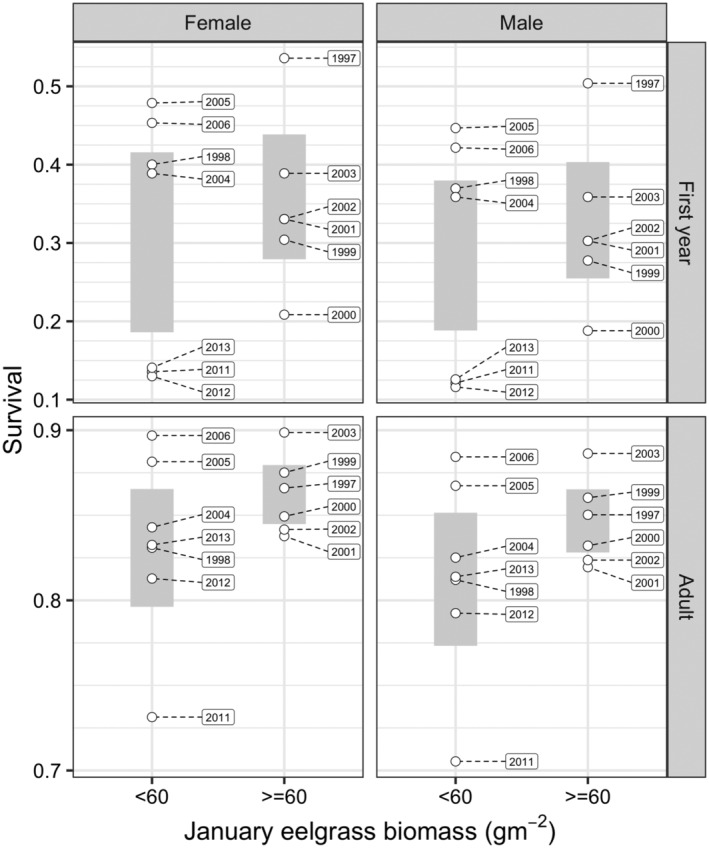
FIGURE 9.

Observed annual survival brant age and sex combinations in years of low (<60 g m−2) and high (>60 g m−2) eelgrass biomass during January (except 2 of 8 sites sampled in 2012 during December). The gray bars show the 95% confidence intervals of mean annual survival.
