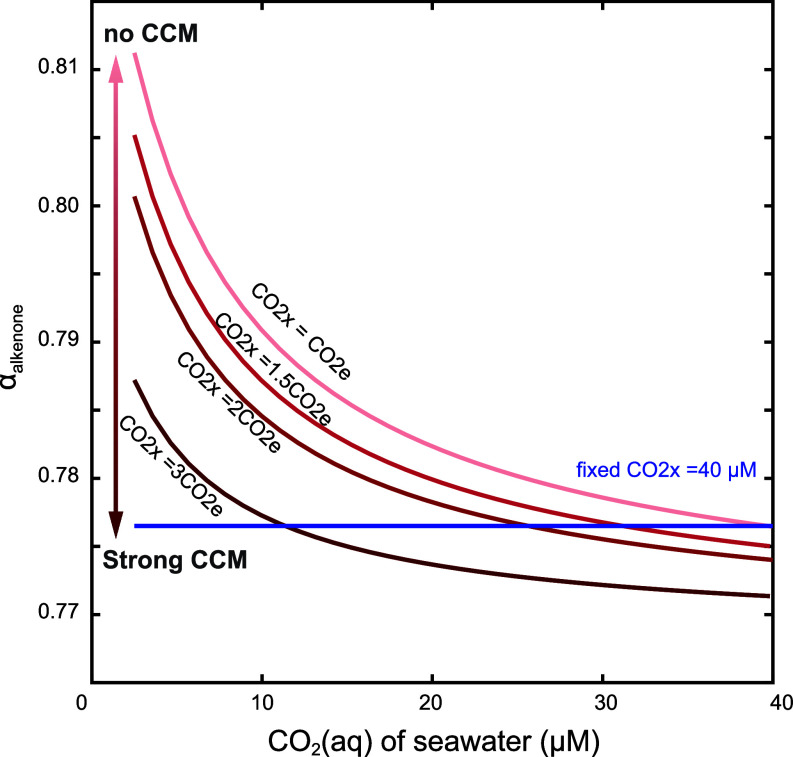
Fig. 5.
Influence of CCM strategies on αalkenone. The intensity of CCM affects CO2 concentration in the chloroplast (CO2x). The pink lines represent different intensities of CCM resulting in a varying CO2x and thereby different αalkenone. The left arrow shows the CCM intensity from non-CCM to strong CCM. The blue line represents that αalkenone does not respond to CO2(aq) if the cells employ a constant CCM (set as 40 µM in this test).

