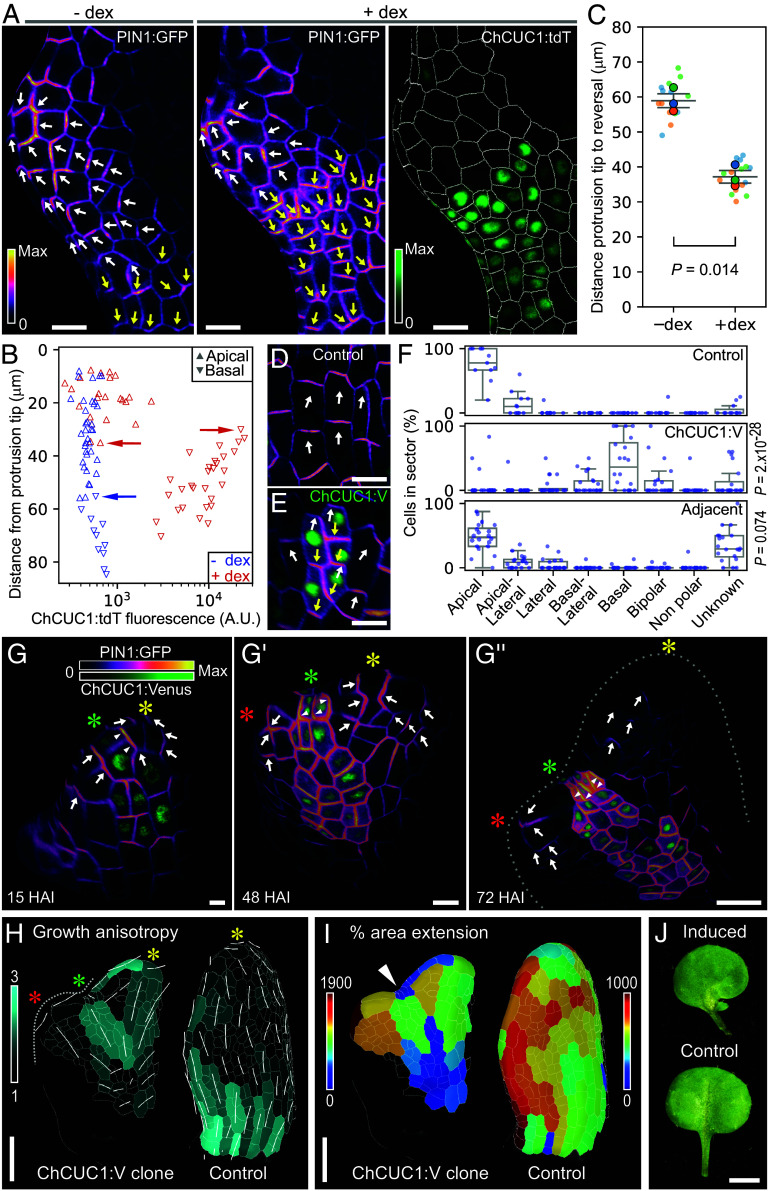
Fig. 2.
ChCUC1 is sufficient to repolarize PIN1 and organize new outgrowths in the leaf margin. (A–C) Effect of ChCUC1 induction on PIN1:GFP polarity during A. thaliana leaf margin patterning. (A) Leaf 4 from ChCUC1p::LhG4:GR; Op6::ChCUC1:tdTomato plants showing PIN1:GFP polarity and ChCUC1:tdT expression 24 h after treatment with dexamethasone (+dex) or mock (−dex) solutions. The white and yellow arrows on the leaf margin cells indicate, respectively, PIN1:GFP polarization toward a protrusion tip, or toward the opposite direction. (B) Analysis of the cells in (A), showing their PIN1:GFP polarity, ChCUC1:tdT expression, and distance from the protrusion tip. The horizontal arrows highlight that PIN1 reversal (downward-pointing triangles) after dex treatment can be explained by the level of ChCUC1:tdT expression, which overrides the polarity pattern of the control sample. (C) Distance from the tip of a protrusion to PIN1:GFP polarity reversal in leaves treated with dex and mock solutions. The reversal position in each leaf (large dots) was calculated by averaging the distances of the five cells closest to the protrusion with clear basal polarity (small dots). n = 3 leaves per treatment. Unpaired t test. (D–F) PIN1:GFP polarity in response to ectopic ChCUC1:V clones in the abaxial epidermis of leaves and sepals of A. thaliana HSp::dBox:Cre; 35Sp::lox--lox::ChCUC1:V. (D and E) Examples of control cells (D) and ChCUC1:V clones (E). The white and yellow arrows indicate, respectively, apical and basal PIN1:GFP accumulation. (F) Frequency of PIN1:GFP polarity directions in control cells, ChCUC1 clones, and neighbors adjacent to ChCUC1:V clones, 24 h after heat shock. n (control) = 11 samples, n (ChCUC1:V clone) = 20. Chi-squared test, P values correspond to comparisons with the control group. (G–J) Effect of leaf margin ChCUC1:V clones on tissue polarity and growth. (G–G’’) PIN1:GFP polarity and ChCUC1:V clone expression in an A. thaliana leaf 1 over 72 h after heat shock induction (HAI). The white arrows on the leaf margin cells indicate the direction of PIN1:GFP accumulation. The yellow asterisk indicates the primary polarity convergence at the apex of the leaf. The green asterisk marks the margin cell lineage containing a ChCUC1:V clone. The red asterisk indicates an ectopic polarity convergence point. Frequency of outgrowths: margin ChCUC1:V clones = 3/3, controls = 0/3. (H and I) Growth anisotropy (H) and area extension (I) of the leaf shown in G–G’’ (over 57 h) and a control sample (over 48 h). The white lines in (H) indicate the main direction and magnitude of growth. The asterisks are as in (G–G’’). The white arrowhead in (I) points at a strong growth repression zone in the margin not observed in the control A. thaliana leaf 1. (J) Final morphology of a control leaf and a leaf subjected to heat shock that shows a margin sinus and an outgrowth. Leaves shown belong to nodes 1 or 2 14 d after sowing. n (induced) = 4, n (control) = 10. (A and G–I) MorphographX surface meshes with epidermal signal projected. [Scale bars: 10 µm (A, D, and E); 10 µm (G–G’’); 30 µm (H and I); 20 mm (J).]

