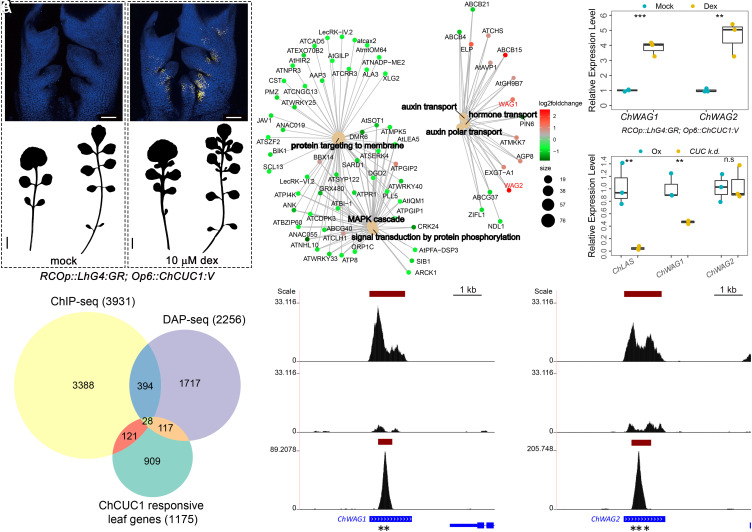
Fig. 3.
Identification of ChCUC1 target genes through transcriptome analysis, ChIP-seq and DAP-seq. (A and B) ChCUC1:V expression (Top) and silhouettes (Bottom) of C. hirsuta rosette leaves 5 and 8 carrying RCOp::LhG4:GR;Op6::ChCUC1:V 2 h after mock (Left) and dexamethasone (dex, Right) treatment. Top panels, maximum intensity projection of confocal stacks. Yellow: Venus signal; blue: chlorophyll autofluorescence. n = 5 transgenic lines. [Scale bars: 100 µm (Upper panels); 1 cm (Lower panels).] (C) Gene-concept network for selected biological processes depicting linkages between significantly enriched GO terms and the associated genes detected after 8 h of ChCUC1:V induction. Each node represents a gene and is color-coded according to its expression fold change. (D) Relative transcript abundance of ChWAG1 and ChWAG2 8 h after ChCUC1:V induction. qRT-PCR performed on C. hirsuta RCOp::LhG4:GR;Op6::ChCUC1:V shoot apices with developing leaves 12 d after sowing. Asterisks indicate statistically significant differences (Unpaired t test, ***P < 0.001, **P < 0.01, *P < 0.05). (E) Proportional Venn diagram depicting the number of ChCUC1 responsive leaf genes, direct ChCUC1 target genes detected by ChIP-seq, direct ChCUC1 target genes detected by DAP-seq, and the overlaps between datasets. Significant enrichment between ChIP-seq and DAP-seq datasets was found by Fisher’s exact test (P < 5.64 × 10⁻¹⁴), as well as between direct ChCUC1 target genes detected by DAP-seq and ChCUC1 responsive leaf genes datasets (P < 6.67 × 10−09), and between direct ChCUC1-target genes detected by ChIP-seq and up-regulated genes in response to ChCUC1 induction (P < 1.85 × 10−06). (F and G) ChIP-seq and DAP-seq binding profiles at the ChWAG1 and ChWAG2 loci. From top to bottom: ChCUC1 MOBE-ChIP-seq using C. hirsuta ChCUC1:V transgenic plants, control MOBE-ChIP-seq using C. hirsuta Ox, and ChCUC1 DAP-seq. Pooled signal from three biological replicates from ChIP-seq or DAP-seq assays are shown. Vertical axes: −log(P-value); red bars: significant peaks; blue bars: exons; asterisks: CUC binding sites. (H) Relative transcript abundance of ChWAG1 and ChWAG2 in C. hirsuta wild type and ChCUC knock-down (CUC k.d., 35Sp::MIR164A;35Sp::CUC3-RNAi) measured by qRT-PCR on developing leaves (300 to 500 µm in length, 12 d after sowing). LATERAL SUPPRESSOR (LAS), a previously described CUC downstream gene (42) was used as a positive control. Same statistical analysis as in (D).

