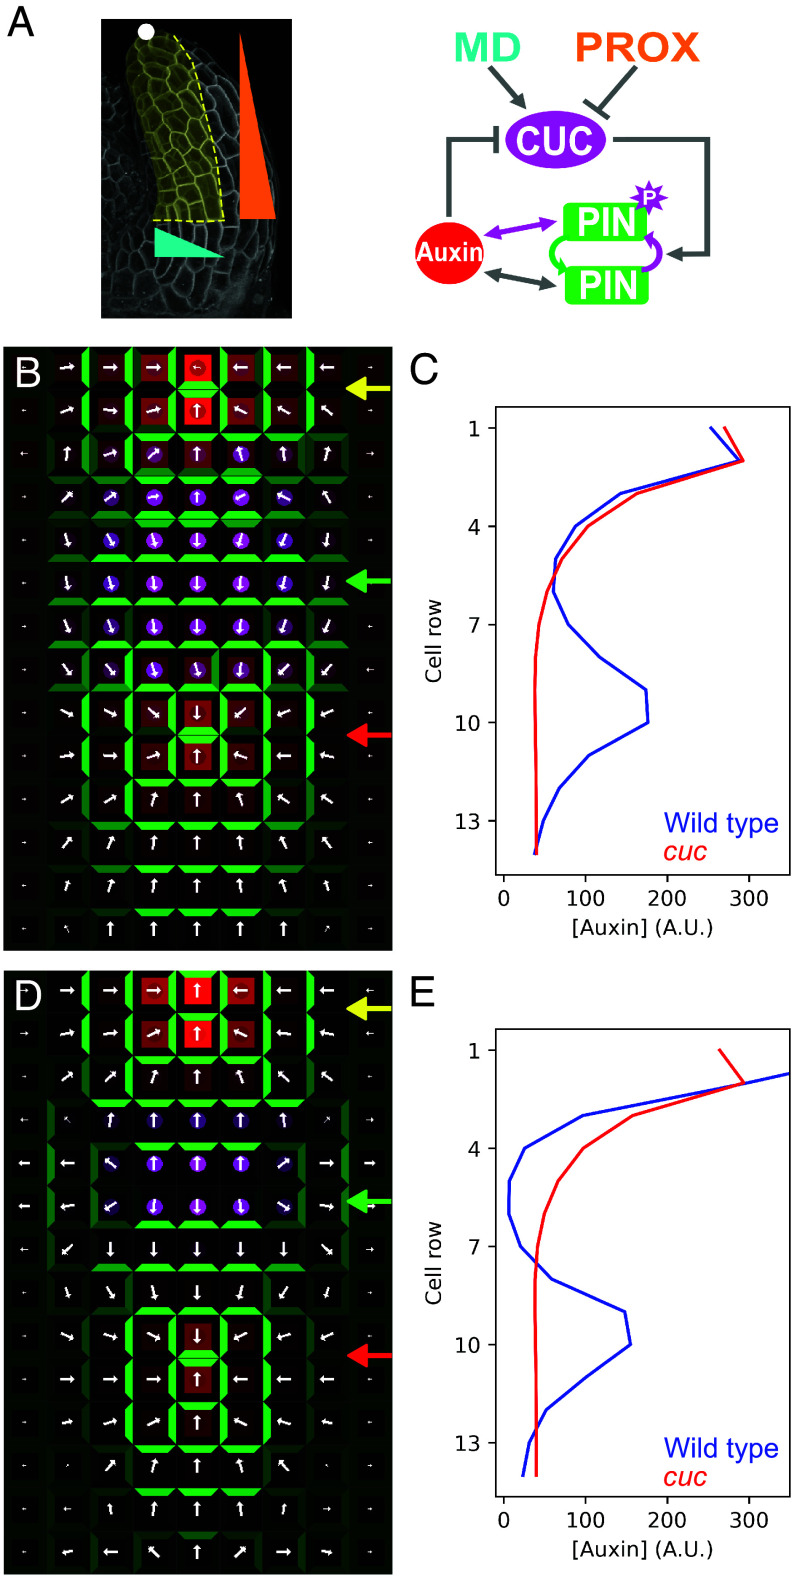
Fig. 5.
Computational models that modulate PIN1 properties in the CUC domain can account for local repolarization and formation of auxin maxima on the leaf margin. (A) Cartoon representing the tissue modeled (Left), which corresponds to the leaf margin during patterning of the first lateral auxin site and protrusion, and network that controls the levels of CUC/auxin and determines the activity and polarization mode of PIN1 (Right). The white dot indicates the apex of the leaf that typically displays an auxin activity maximum, and that has been modeled as an auxin source. The wedges indicate the spatial distribution of the middle domain (MD, cyan) and proximal domain (PROX, orange) identity factors used to model the CUC expression domain (for details see SI Appendix). The straight bidirectional arrows indicate the PIN-auxin feedback loops. (B–E) Output of the PIN polarization modulation model (CUC-induced PIN phosphorylation switches PIN polarization mode from up-the-gradient to with-the-flux, B and C) and the PIN efficiency modulation model (CUC-induced PIN phosphorylation increases PIN transport efficiency, D and E). (B and D) Simulations steady state of wild-type leaf margins showing a distal auxin maximum and associated polarity convergence (yellow arrow), CUC-dependent PIN1 repolarization (green arrow), and formation of an emergent convergence point (red arrow). CUC, PIN, and auxin are color coded as in (A). The white arrows indicate the direction of net PIN1-mediated auxin transport in each cell. (C and E) Auxin profiles along the central cell column (middle domain) of the simulations shown in (B) and (D) respectively (blue), and from control simulations without CUC (red) that fail to generate emergent auxin foci.

