
Fig. 2.
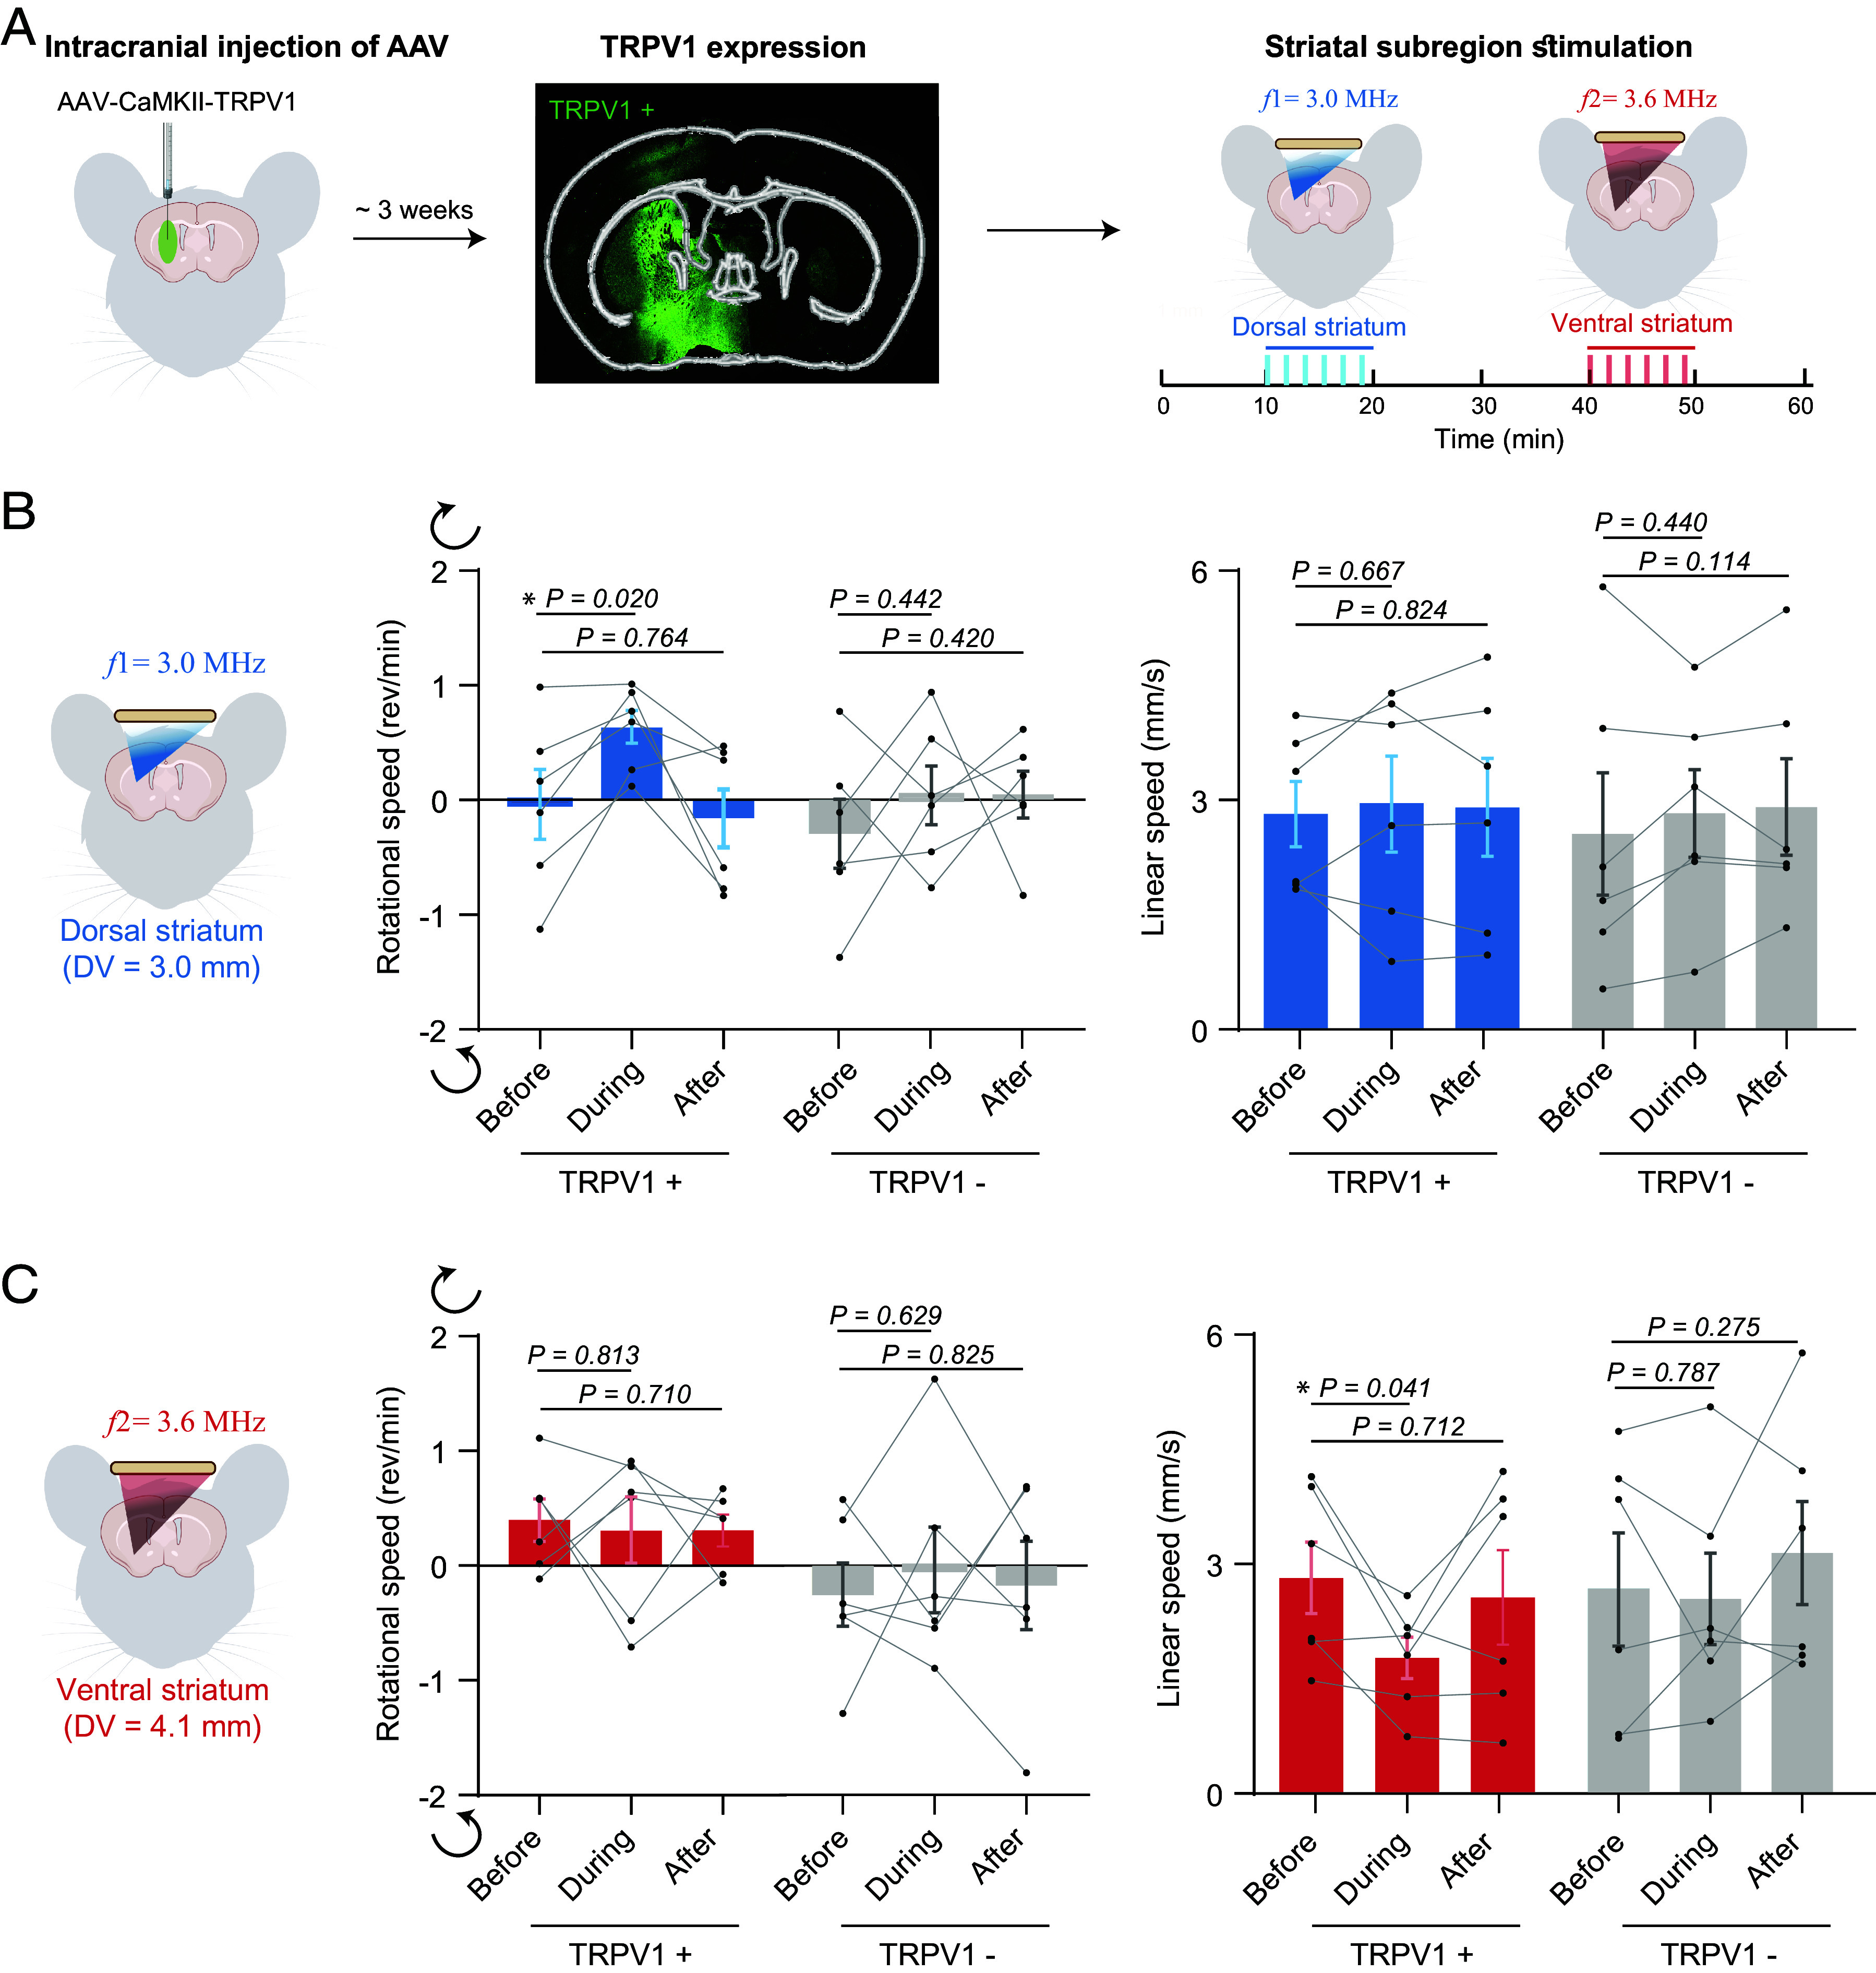
AhSonogenetics enables precise activation of distinct striatum subregions. (A) Schematic illustration of the experimental procedure. AAV-CaMKII-TRPV1 was intracranial injected into the striatum, encompassing dorsal and ventral subregions. Approximately 3 wk after viral injection, TRPV1 expression was validated through immunofluorescence staining using an anti-TRPV1 antibody. The Airy-beam metasurface shown in Fig. 1 D and E was used to target the dorsal and ventral striatum within a single mouse brain. Every test was composed of six repeated stimuli (shown as blue or red bars). (B) Analysis of rotational and linear speeds of TRPV1+ mice (mice injected with AAV9-CaMKII-TRPV1) compared to TRPV1− mice (mice injected with AAV9-CaMKII-mCherry) with ultrasound stimulation at the dorsal striatum. The dorsal–ventral (DV) location of the target was at 3.0 mm. Positive and negative rotational speed values correspond to rotation in the contralateral (clockwise) and ipsilateral (counterclockwise) direction, respectively. (C) Analysis of rotational and linear speed of TRPV1+ mice versus TRPV1− mice with ultrasound targeting the ventral striatum (DV = 4.1 mm). The data are based on n = 6 mice in the TRPV1+ and TRPV1− groups. Each mouse received six repeated ultrasound stimulations. Each dot in the bar plot represents the mean of the six repeated measurements for each mouse. Each bar plot represents the mean value across the six mice, with error bars indicating the standard error of mean (SEM). Statistical significance was determined using one-way ANOVA followed by Fisher’s LSD multiple-comparison post hoc test.