Fig. 4.
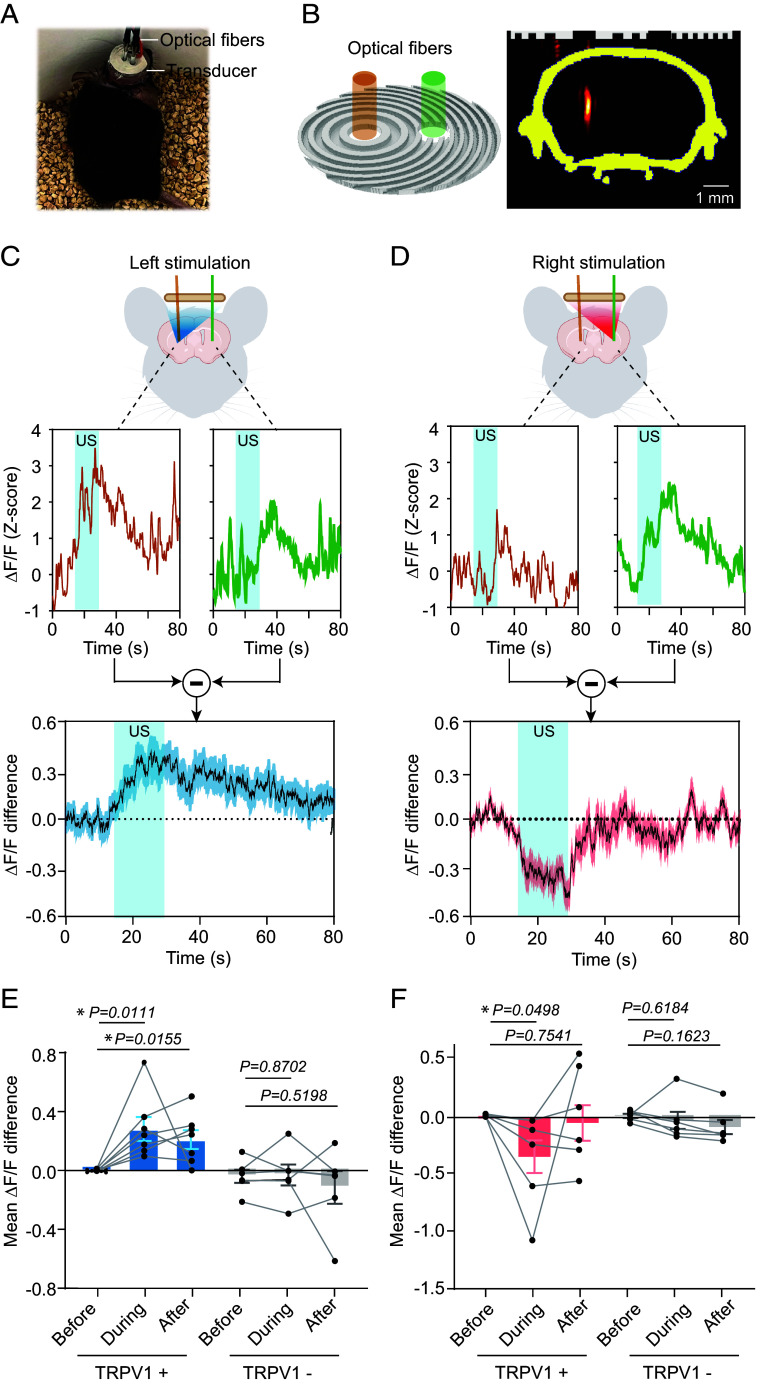
Integration of AhSonogenetics with fiber photometry. (A) Picture of a mouse with a wearable ultrasound device integrated with two optical fibers for fiber photometry recording. (B) 3D design of the Airy-beam metasurface for ultrasound stimulation of the left striatum, featuring two holes for optical fiber insertion. Experimental calibration confirmed that the presence of these holes did not compromise the focusing capability of the metasurface. (C, D) Representative fiber photometry recording of calcium activities (ΔF/F) in the left and right striatum during ultrasound (US) stimulation at the left (C) or right (D) striatum. The Lower panel presents the calcium activity difference between the left and right striatum with shaded vertical bars indicating the ultrasound stimulation period. (E and F) Comparison of the mean ΔF/F differences before, during, and after ultrasound stimulation in TRPV1+ mice and TRPV1− mice when ultrasound stimulation in the left (E) or right (F) striatum. The sample sizes are n = 7 for TRPV1+ mice and n = 6 for TRPV1− mice, with each mouse undergoing six repeated sonications. Each data point in the bar plots represents the mean of the six repeated measurements for each mouse, while each bar plot represents the mean value among all mice and error bars indicate the SEM. The statistical analysis was performed via one-way ANOVA followed by Fisher’s LSD multiple-comparison post hoc test.

