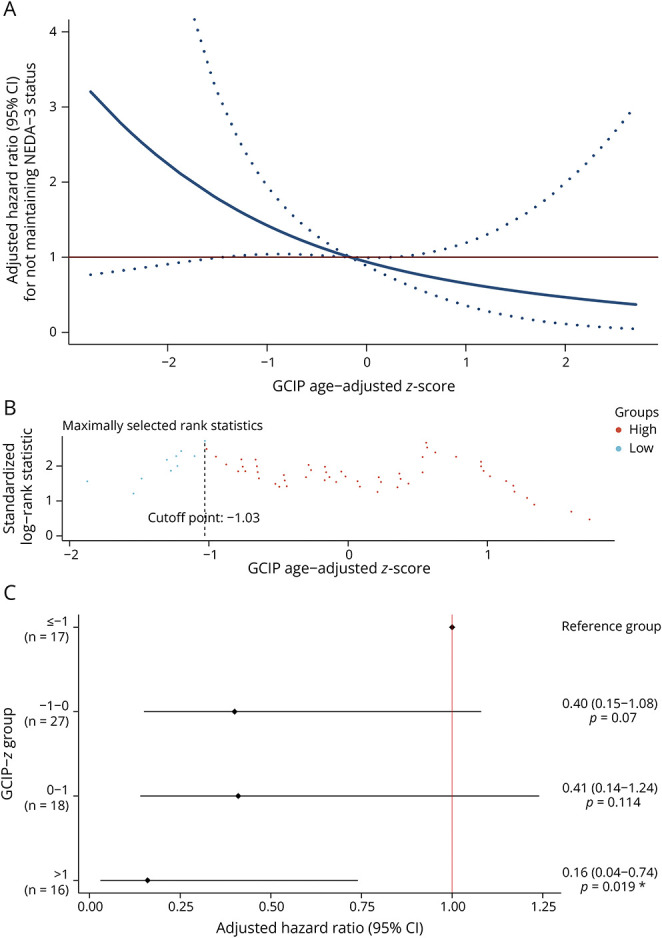
Figure 3. Association Between Risk of Future Disease Activity and GCIP z Scores in PweMS.

Multivariable analyses adjusted for sex, disease duration, and use of disease-modifying therapies at baseline. (A) Multivariable-adjusted hazard ratio for new disease activity to GCIP age-adjusted z score on a continuous scale. The solid blue line indicates the multivariable-adjusted hazard ratio, with dashed blue lines showing the 95% CIs derived from restricted cubic spline regressions with 3 knots. The solid red line is the reference line for no association at a hazard ratio of 1.0. (B) Optimal GCIP age-adjusted z score cutoff point for determination of PwMS with higher risk of having new disease activity. (C) Multivariable-adjusted hazard ratio for new disease activity according to categories of GCIP age-adjusted z score. GCIP = combined macular ganglion cell and inner plexiform layer thickness; PweMS = people with early multiple sclerosis.
