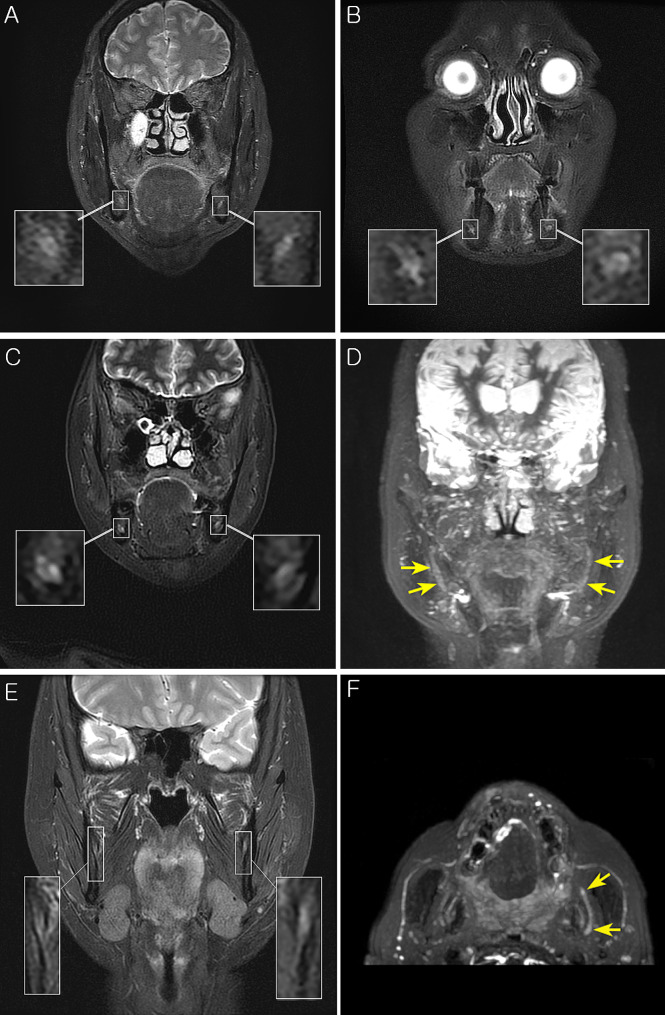
Fig. 3.
Example MR images demonstrating features of present study. (A-B) Representative high contrast MR images with sufficient resolution to demonstrate nerve fascicles; (C) Representative cross-sectional view demonstrating higher signal of trauma side (Right IAN); (D) Maximum intensity projection of (C) also demonstrates asymmetric hyperintensity of traumatized (right) nerve; (E) Representative cross-sectional T2 Flex image including the ROI of the traumatic left lingual nerve; (F) Maximum intensity projection of (E) demonstrating ‘Triple B’ sign of left lingual nerve (arrow)

