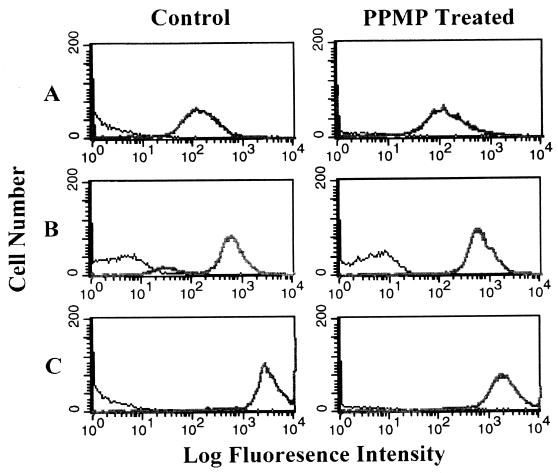
FIG. 3.
Flow cytometry of CD4 and chemokine receptor expression in control and PPMP-treated cells. Expression levels of CD4, CXCR4, and CCR5 in GHOST-345 cells were examined by using control (left panel) and PPMP-treated (right panel) cells. Cells were incubated for 1 h at 4°C with PE-conjugated mouse IgG anti-CD4 (RPA-T4) (A), PE-conjugated mouse IgG anti-CXCR4 (12G5) (B), or PE-conjugated mouse IgG anti-CCR5 (2D7) (C). Fluorescence was examined with a Becton Dickinson FACScalibur at 10,000 events/sample. Control and PPMP-treated unlabeled cells were run as background. The surface concentrations of CD4, CXCR4, and CCR5 estimated from the observed median fluorescence intensities relative to median intensities for cells with known amounts of those receptors bound to their specific antibodies are about 5.2 × 10⁴, 2.3 × 10⁵, and 1.1 × 10⁶ molecules/cell, respectively.

