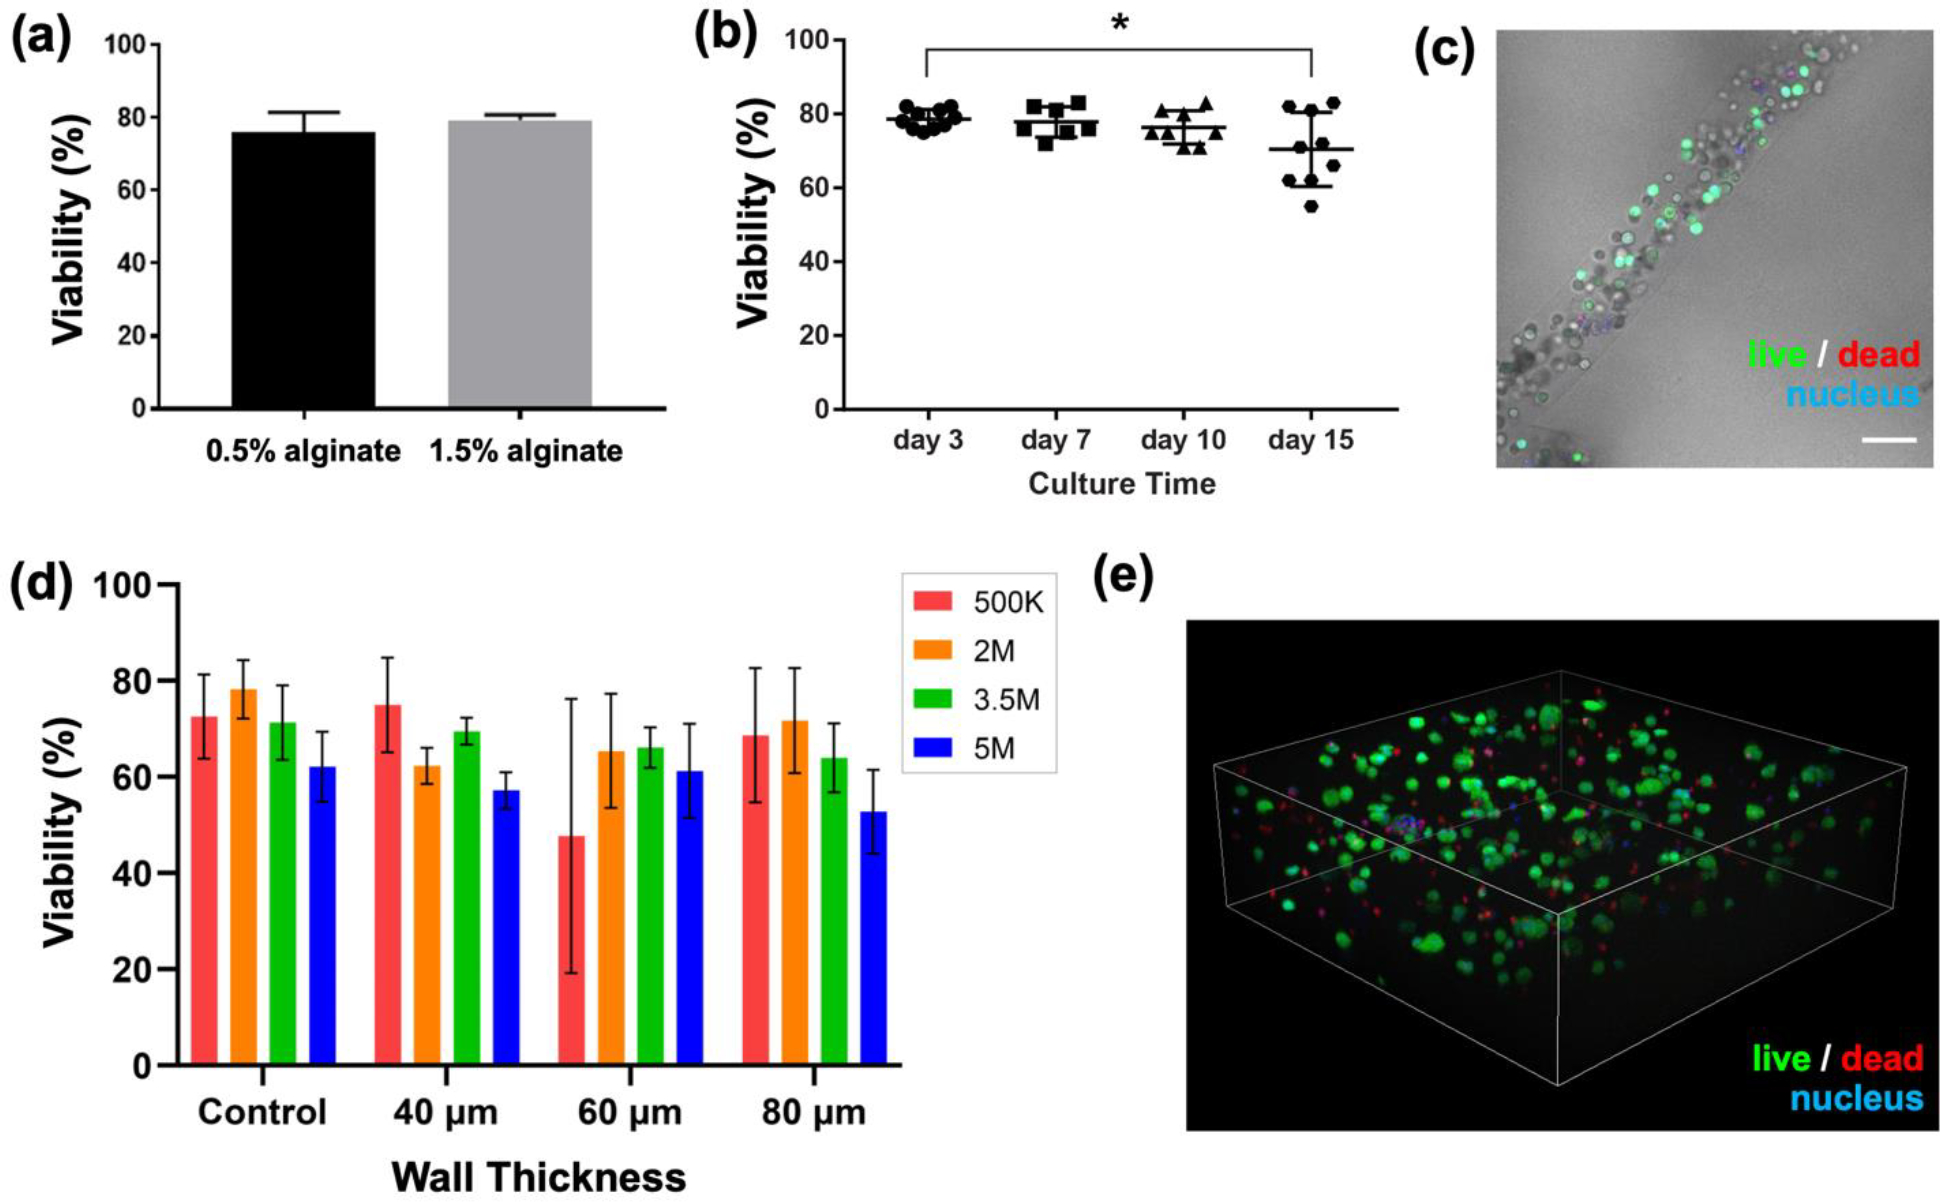
Figure 6. Salivary epithelial cells can be printed with minimal impact on viability.

(a) Cells bioprinted in 0.5% or 1.5% (w/v) alginate fibers retained indistinguishable viability three days after bioprinting. (b) Viability of hS/PCs bioprinted in 1.5% (w/v) alginate fibers was monitored over time. Each data point represents one sample. Error bars indicate +/− standard deviation. * p< 0.05. (c) A representative bright field image overlaid with live/dead staining confocal image shows hS/PC distribution within the bioprinted fiber structure (from day 3 sample with 5.0 × 10⁶ cells/mL density). Scale bar = 100 μm. (d) hS/PC viability within the printed hollow tubes, quantified as a function of both cell density (noted in legend as cells/mL) and wall thickness (x-axis) vs. bulk control (no printing). Error bars indicate +/− standard deviation for n=3 measures. (e) Representative 3D rendering of Z-stack images taken of bioprinted hS/PCs after being stained in a viability assay. Image shows 2E6 cells/mL density in 40 μm wall thickness hollow tube samples. Dimensions of Z-stack: width: 636.4 μm; depth: 636.4 μm; height: 201.4 μm.
