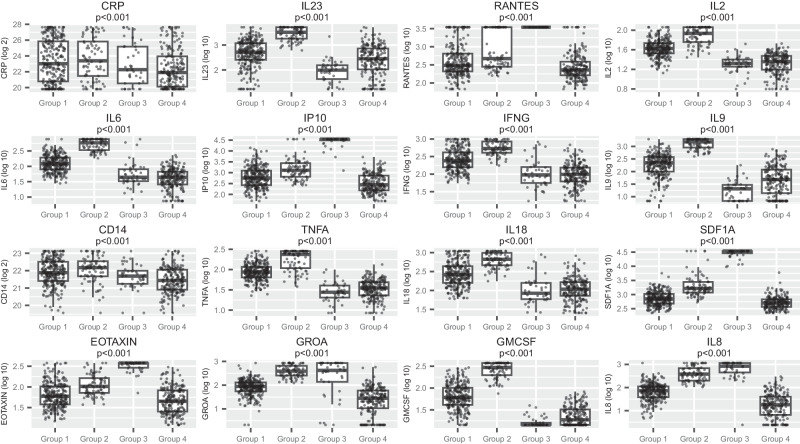
Fig. 2. Distribution of key baseline biomarkers in 4 sub-groups identified through hierarchical clustering of principal components of 23 baseline biomarkers.
Hierarchical clustering was undertaken following a principal components analysis, which included all biomarkers, CD4 and viral load, with variables standardised before analysis. The top principal components were used in the hierarchical cluster analysis using Ward’s linkage, with the number of clusters determined by the Calinski-Harabasz stopping rule. Box plots show the biomarker distributions within the four clusters identified. The boxes show the 25th and 75th percentiles, and the central line marks the median value. The whiskers extend to the most extreme value no further than 1.5*IQR from the 25th/75th percentile. Each individual value is plotted as a dot. Values above the limit of detection were set at that limit; for example, all RANTES values in group 3 were at the limit of detection. N = 585. P-values from Kruskal–Wallis tests. All values presented are below Benjamini–Hochberg (BH) threshold. Source data are provided as a Source Data file.

