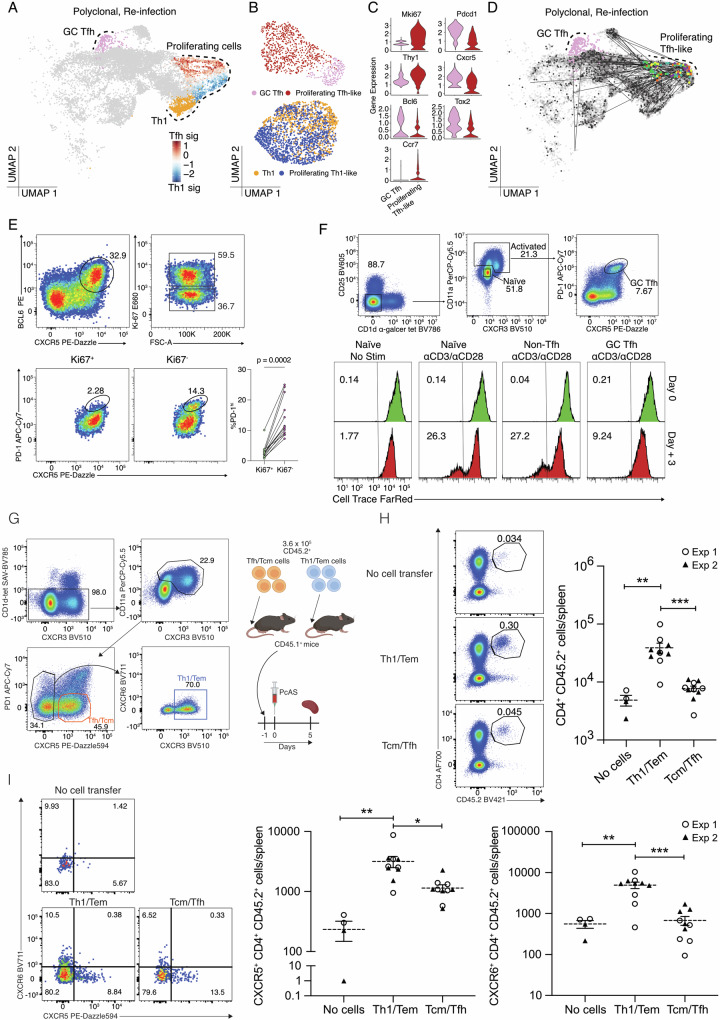
Fig. 7. TCR diverse polyclonal GC Tfh cells lack the capacity to proliferate upon re-infection.
A UMAP of CD11ahiCXCR3+ polyclonal CD4+ T cells 3 days post-re-infection with cell states depicted by colours and dotted boundaries. Proliferating cells show Tfh/Th1 signature scores. B UMAP of proliferating Tfh-like cells and GC Tfh cells 3 days post-re-infection (Top) and UMAP of proliferating Th1-like cells and Th1 cells (Bottom) after regressing out G2M phase and S phase signature scores. C Violin plots showing expression of genes associated with proliferation (Mki67), GC Tfh (Pdcd1, Thy1—expressed at a low level in GC Tfh cells), Tfh (Cxcr5, Bcl6, and Tox2), and TCM (Ccr7). D UMAP of CD11ahi CXCR3+ polyclonal CD4+ T cells (with 5% spike-in of CD11aloCXCR3- naïve cells) showing GC Tfh cells highlighted in pink and TCR sharing (straight edges) from those proliferating Tfh-like cells (coloured by mouse of origin; n = 5 mice). E Gating strategy to identify proliferating and non-proliferating Tfh-like cells (Top). FACS plots and scatter plot of PD-1 expression on Ki67+ and Ki67- Tfh-like cells (Bottom). FACS plots are representative of three independent experiments, with at least four mice per experiment (n = 13 total). Wilcoxon matched-pairs signed rank test was used to assess difference in PD-1 expression between Ki67+ and Ki67− populations pooled from three independent experiments. F Sorting strategy for isolated T cell subsets from anti-malarial treated mice following infection with PcAS (Top). Representative histograms (from two independent experiments) showing CellTraceTM Far Red intensity in naïve (no stimulation), naïve (anti-CD3/anti-CD28 stimulation), non-Tfh (anti-CD3/anti-CD28 stimulation), and GC Tfh (anti-CD3/anti-CD28 stimulation) populations prior to and 3 days post-stimulation (Bottom). G Experimental design: antigen-experienced TCM/Tfh-like or non-Tfh cells (harbouring Th1-like Tem cells) were sorted from infected/drug-treated mice at 28 days post-infection. 360,000 cells were transferred into separate groups of naïve, congenically marked recipient mice, which were infected the following day. Spleens were assessed 5 days later. H Representative FACS plots showing gating strategy to detect CD4+ CD45.2+ cells, including a “no cell transfer control”, and scatter plots of numbers of splenic CD4+ CD45.2+ cells; one-way ANOVA with Šídák’s multiple comparison testing; ***P = 0.0008; **P = 0.0051. I Representative FACS plots and gating for assessment of CXCR5 and CXCR6 expression by CD4+ CD45.2+ cells, and corresponding scatter plots of numbers of CXCR5+ or CXCR6+ CD4+ CD45.2+ cells. Scatter plots show data from 2 independent experiments (n = 2/experiment for “no-cell transfer”; n = 5/experiment for other groups). Bars represent mean ± SEM; one-way ANOVA with Šídák’s multiple comparison testing, CXCR5 plot: *P = 0.0137, **P = 0.0068; CXCR6 plot **P = 0.0020, ***P = 0.0001.

