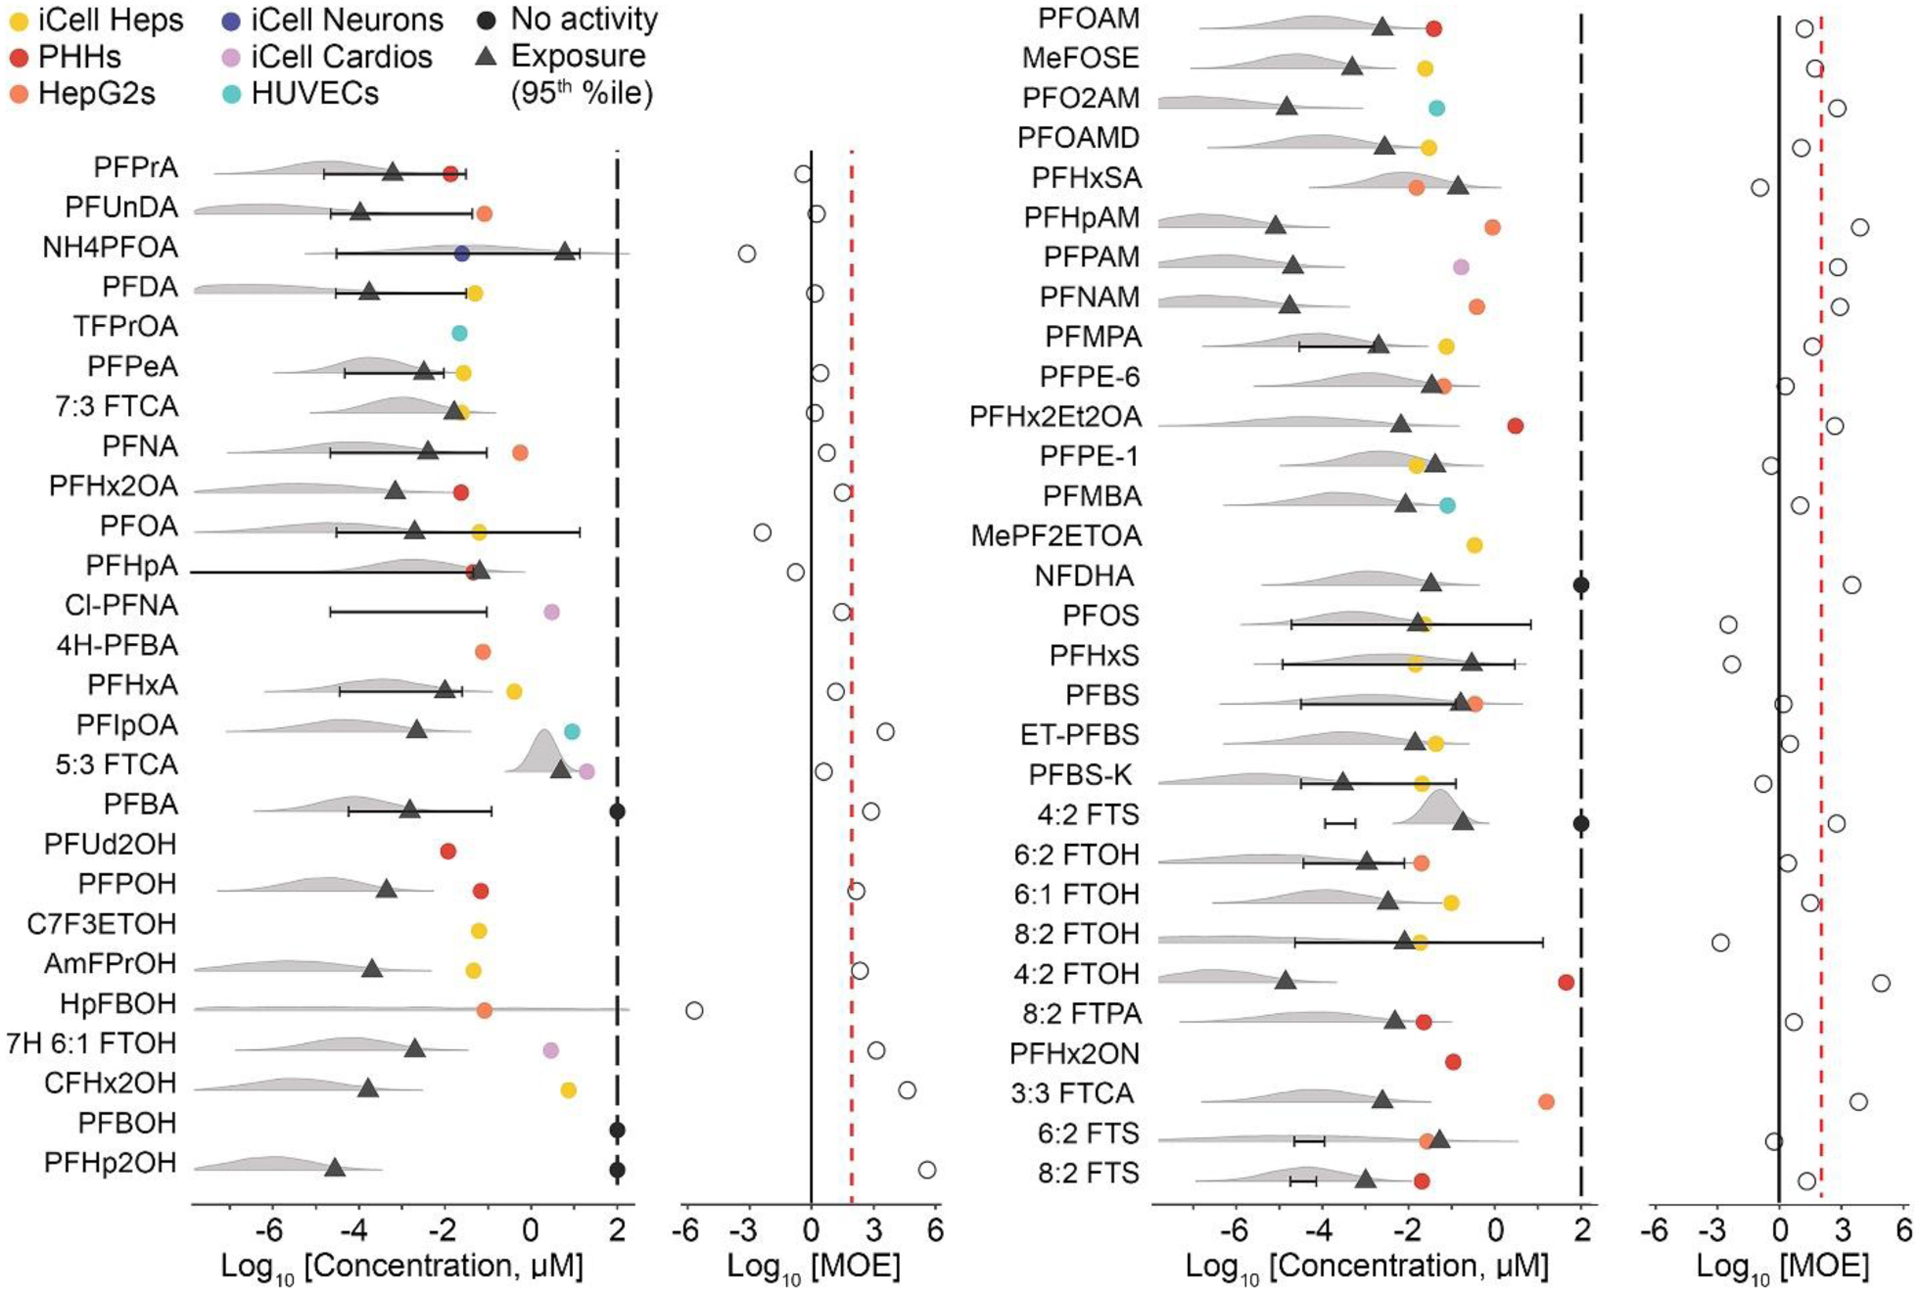
Figure 7. Risk characterization of PFAS.

Margin of Exposure (MOE) for each PFAS was calculated by combining all phenotypic PODs and using the most sensitive POD (most bioactive POD) and dividing it by chemical-specific exposure data (using exposure predicted data or human blood levels). The grey density plots represent the uncertainty distribution for the modeled population median exposure reported on the CompTox Dashboard, with diamonds representing the predicted 95th upper percentile; black lines/error bars represent the 5th to 95th percentiles for measured blood levels in humans reported in the literature. Colored dots represent the cell type (see legend) from which the most sensitive phenotypic POD was derived, black dots denote chemicals that were without effect across all models, and vertical black lines indicate the median POD across all PODs. The ratio between exposure and bioactivity is demonstrated as the MOE (on a log10 scale, open circles), the vertical red dashed line represents a margin of 100 and the vertical solid line represents a margin of 1.
