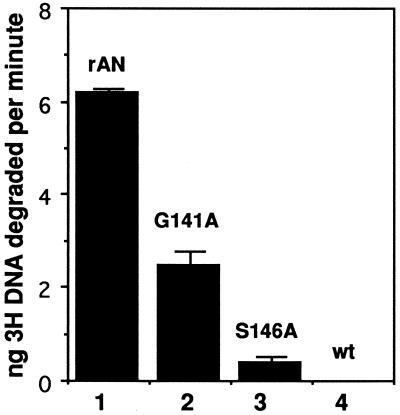
FIG. 6.
Quantification of activity of mutant and wt AN. For details, see Materials and Methods. All samples were done in triplicate, and the error bars represent 1 standard deviation. The experiment is representative of at least two different infection and extract preparations for each mutant virus. Lane 4 is a sample from wt AcMNPV-infected cells processed as described in the legend to Fig. 5.

