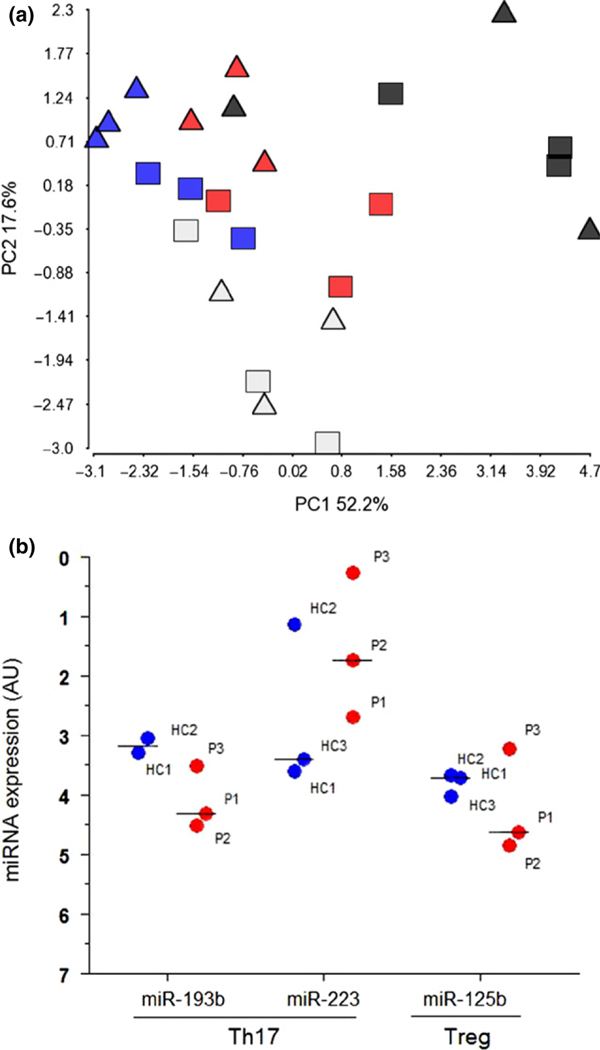
Figure 2.
MicroRNA expression in T-cell subsets. (a) A PCA based on the expression of 10 miRNAs (miR-99a, miR-125b, miR-193b, miR-21, miR-223, miR-425, miR-142–3p, miR-146a, miR-155 and let-7i) measured in four T-cell subset [naïve CD4+ (black), Th1 (blue), Th17 (red) and Treg (grey)]. Triangles = healthy controls, squares = patients with psoriasis. (b) Quantitative real-time PCR of miR-193b, −223 and −125b in T-cell subsets from patients with psoriasis (red dots) compared with healthy controls (blue dots). Median expression of each miRNA is depicted. MicroRNA expression was normalized to the global mean. No statistics were applied as n = 3 + 3. AU, arbitrary units; HC, healthy control; P, psoriasis; Th17, T helper 17 T cells; Treg, regulatory T cells.

