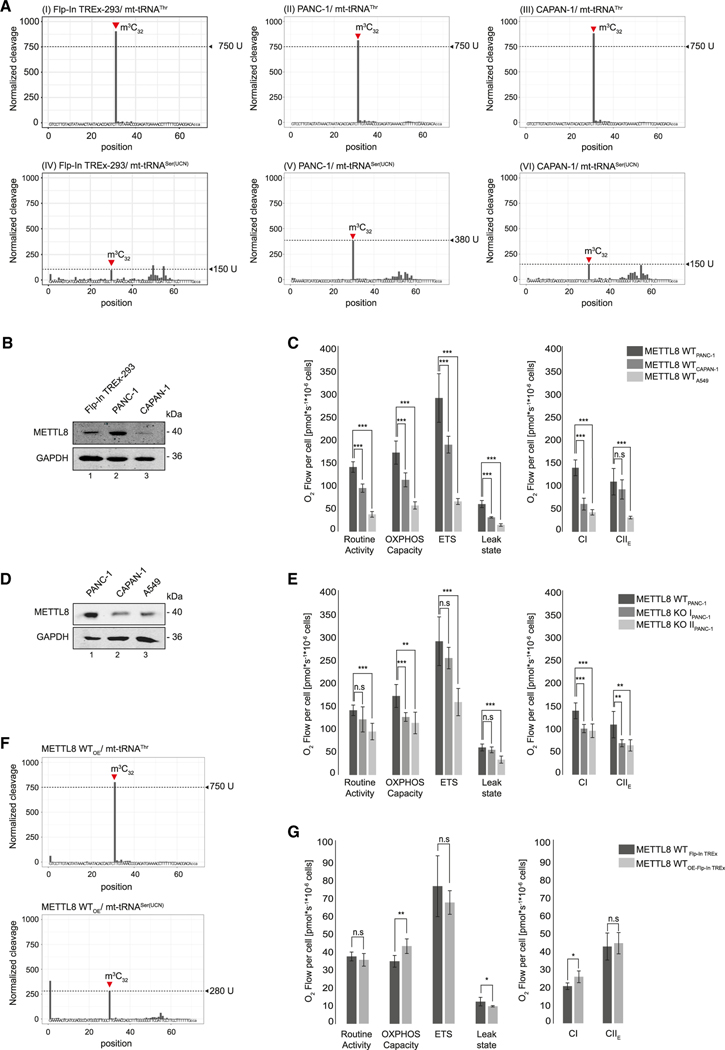
Figure 6. METTL8 expression regulates m3C32 level of mt-tRNASer(UCN).
(A) AlkAniline-seq analysis of mt-tRNAThr and mt-tRNASer(UCN) in Flp-In TREx293, PANC-1, and CAPAN-1 cell lines. Top: m3C cleavage profiles of mt-tRNAThr. Bottom: m3C cleavage profiles of mt-tRNASer(UCN).
(B) METTL8 expression level in Flp-In TREx293, PANC-1 and CAPAN-1 cell lines after anti-METTL8 IP. GAPDH was used as control.
(C) Oxygraph-2k measurements of PANC-1 (dark gray), CAPAN-1 (gray) and A549 (light gray) cell line using the substrate-uncoupler-inhibitor-titration-protocol with FCCP. Means ± SED of four independent measurements are plotted; n.s p > 0.05, ** p < 0.01, *** p < 0.0001 in t test.
(D) METTL8 expression level in PANC-1, CAPAN-1, and A549 cell line after anti-METTL8 IP. GAPDH was used as control.
(E) Oxygraph-2k measurements of WT METTL8 (dark gray) and METTL8 KO (light gray) PANC-1 cell lines. Respiratory activity analysis was performed as in (C). Means ± SED of four independent measurements are plotted; n.s p > 0.05, ** p < 0.01, *** p < 0.0001 in t test.
(F) m3C cleavage profiles of mt-tRNAThr (top panel) and mt-tRNASer(UCN) (bottom panel) in Flp-In TREx293 cells overexpressing METTL8 WT.
(G) Respiratory activity of METTL8 WT (dark gray) and METTL8 overexpressing (WTOE) (light gray) Flp-In TREx293 cell line analyzed by high-resolution respirometer Oxygraph-2k as described in (C). Means ± SED of four independent measurements are plotted; n.s p > 0.05, * p < 0.05, ** p < 0.01 in t test.

