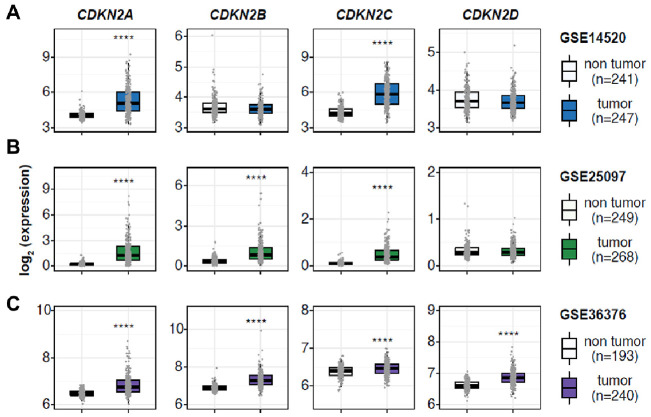
Fig. 1.
CDKN2 gene expression profiles in normal liver and hepatocellular carcinoma (HCC) indicating the implication of CDKN2 in HCC development. (A-C) Boxplots showing relative mRNA levels of CDKN2 gene in patients with HCC belonging to three independent cohorts. The horizontal line crossing each box designates the median, while the top and bottom edges represent the first (25%) and third quartiles (75%), respectively. The dots indicate the expression value of each subject. ****P < 0.0001.

