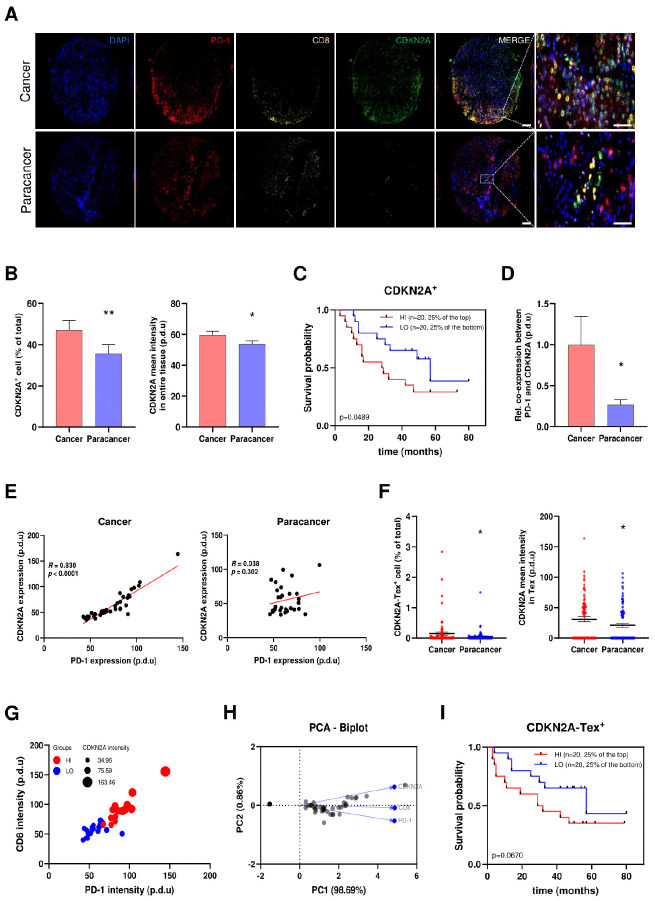
Fig. 4.
Microarray-based analysis verified the correlation between CDKN2A and T cell exhaustion (Tex) status in the context of HCC. (A) Representative immunofluorescence staining indicating the differential expression patterns of CDKN2A in HCC compared to normal tissues, as well as the co-expression among CDKN2A and Tex markers PD-1 and CD8. Scale bar: 200 μm (Merged figure), 50 μm (Enlarged figure). (B) The expression patterns of CDKN2A in HCC and normal tissues. (C) Kaplan-Meier curves verifying the implication of CDKN2A in HCC advancement. (D) The normalized co-expression percentage between PD-1 and CDKN2A in cancer and adjacent paracancer tissues. (E) The co-expression feature plot of CDKN2A and PD-1 in cancer and paracancer tissues, respectively. (F) The expression patterns of CDKN2A in Tex. (G) Bubble chart from multivariate analysis displaying the correlation among CDKN2A, CD8+, and PD-1 expression. (H) Principal Component Analysis (PCA) Biplot revealing the correlation among CDKN2A, CD8+, and PD-1. PC: Principal Component. (I) Kaplan-Meier curves elucidating the implication of CDKN2A-Tex in HCC progression. *P < 0.05, **P < 0.01.

