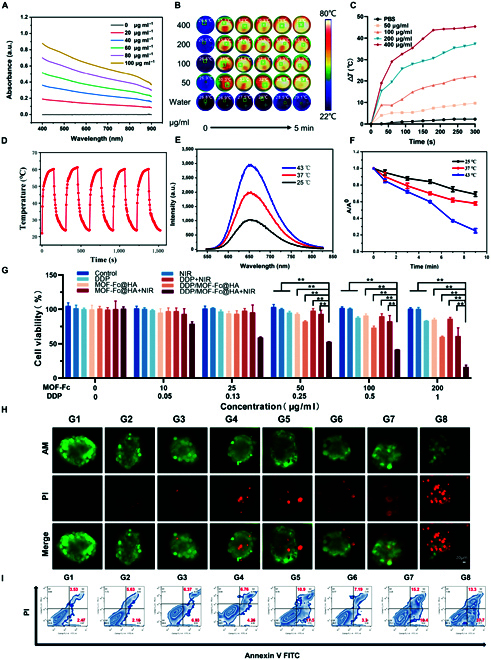
Fig. 3.

In vitro photothermal activity and Fenton catalysis. (A) UV–vis–NIR absorption spectra of MOF-Fc. (B) Infrared thermal images of different concentrations of DDP@MOF-Fc and (C) photothermal warming curves under NIR irradiation (808 nm, 1.0 W cm−2, approximately 10 cm from the bottom of the cell dish) for 5 min. (D) MOF-Fc was alternately heated and cooled at the same concentration for 5 cycles under irradiation with NIR (808 nm, 1.0 W cm−2, approximately 10 cm from the bottom of the cell dish). (E) Colorimetric reaction of TMB with DDP/MOF-Fc@HA at different temperatures. (F) Degradation of methylene blue (MB) at 654 nm by DDP/MOF-Fc@HA. (G) The cell viability profiles of Hepa 1-6 cells after incubation with different concentrations of drugs under different treatments (n = 4). (H) Calcein (AM)/PI costained CLSM images of 3D tumor spheres in Hepa 1-6 cells. (I) Flow cytometry patterns of Hepa 1-6 cells after Annexin V-FITC/PI costaining. For the G1 control (PBS), G2 (NIR), G3 (DDP), G4 (MOF-Fc@HA), G5 (DDP/MOF-Fc@HA), G6 (DDP+NIR), G7 (MOF-Fc@HA+NIR), and G8 (DDP/MOF-Fc@HA+NIR) groups, the cells were first incubated at the corresponding concentrations for 2 h after the NIR groups were treated by irradiation using an 808-nm near-infrared NIR (808 nm, 1.0 W cm−2, approximately 10 cm from the bottom of the well plate dish). **P < 0.01.
