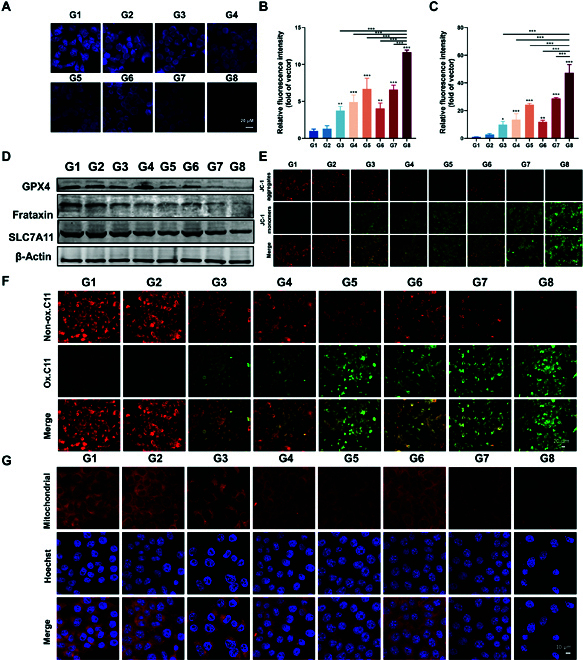
Fig. 4.

In vitro ferroptosis investigations: (A) CLSM images of Hepa 1-6 cells after treatment with a GSH indicator (i.e., ThiolTracker). (B) Corresponding quantitative fluorescence signal intensities of CLSM images of Hepa 1-6 cells after staining with an •OH indicator (i.e., the hydroxyl radical fluorescent probe O28) after different treatments. (C) Corresponding quantitative fluorescence signal intensities of CLSM images of Hepa 1-6 cells after staining with an ROS indicator (i.e., DCFH-DA) after different treatments. (D) Western blotting was used to detect changes in glutathione (GPX4), frataxin, and SLC7A11/Xct (R) protein expression in Hepa 1-6 cells. (E) CLSM images of Hepa 1-6 cells after JC-1 probe staining after different treatments were used for direct assessment of mitochondrial damage, where the expression of the JC-1 monomer (green fluorescence) was positively correlated with the extent of mitochondrial damage. (F) CLSM images of Hepa 1-6 cells after Image-iT (lipid peroxidation) and (G) mitochondrial probe staining after different treatments. G1 control (PBS); G2 (NIR); G3 (DDP); G4 (MOF-Fc@HA); G5 (DDP/MOF-Fc@HA); G6 (DDP+NIR); G7 (MOF-Fc@HA+NIR); and G8 (DDP/MOF-Fc@HA+NIR). The cells were first incubated at the corresponding concentration for 2 h after the NIR groups were treated by irradiation using an 808-nm near-infrared NIR (808 nm, 1.0 W cm−2, approximately 10 cm from the bottom of the well plate dish). *P < 0.05, **P < 0.01, ***P < 0.001.
