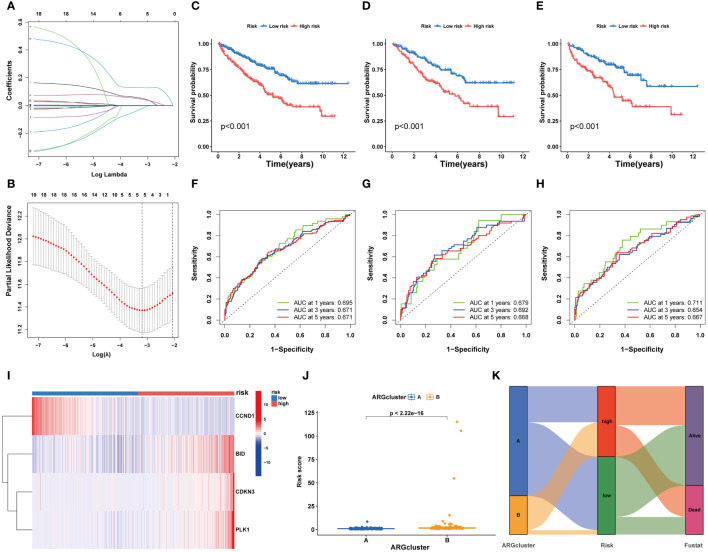
Figure 5.
Development and validation of a risk prognostic model for ccRCC patients. (A, B) Lasso Cox regression analysis. (C-E) K-M curves of ccRCC patients under high and low risk. (F-H) ROC curves of ccRCC patients under high and low risk. (I) Heatmaps exhibit 4 core ARGs expression patterns. (J) The riskscore levels in two ARGclusters. (K) Alluvial plots.

