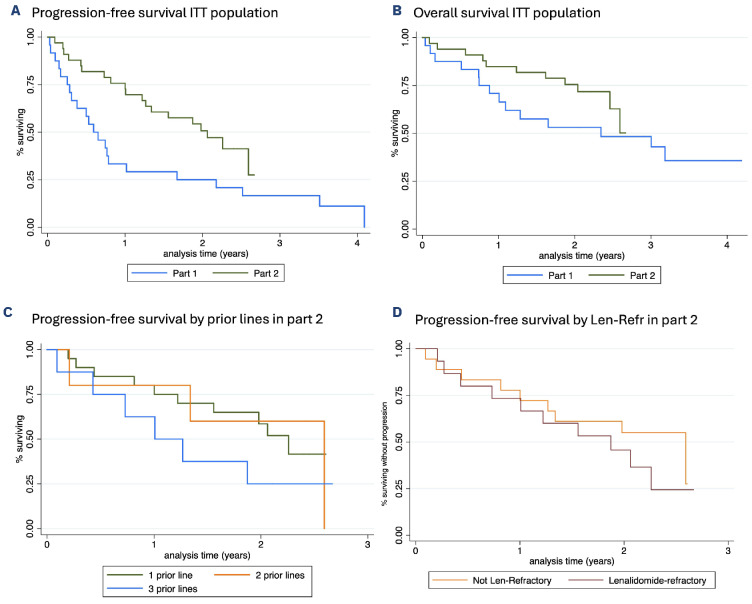
Figure 4.
Kaplan-Meier survival curves in part 1 and 2 of the study. Panel (A) shows progression-free survival for (PFS) the intention-to-treat (ITT) population in part 1 and part 2. Panel (B) shows overall survival for the ITT population in part 1 and part 2. Panel (C) shows PFS for patients according to number of prior lines (PL) of therapy; Panel (D) shows PFS according to lenalidomide refractoriness (len-ref) in part 2 of the trial.

