Figure 1.
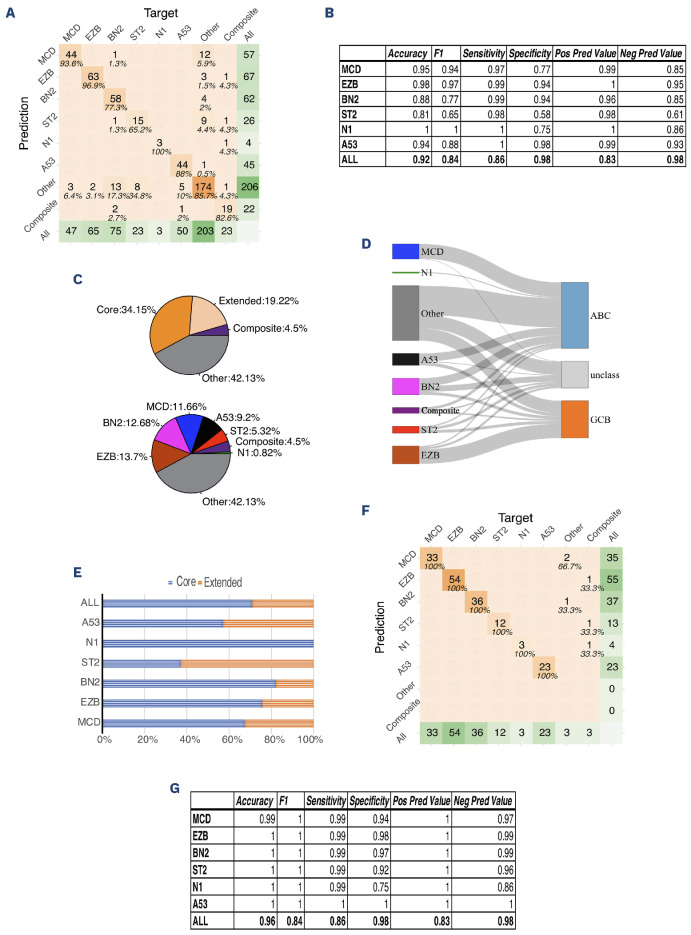
LymphGen classification on National Cancer Institute cohort data filtered by IMPACT panel. (A) Confusion matrix of IMPACT panel compared to National Cancer Institute (NCI) panel (all cases). The target represents the classification by NCI panel; the prediction represents the classification by IMPACT panel. The center number shows the number of cases; the percentage represents the proportion of cases classified by the IMPACT panel for a certain subtype in the cases classified by the NCI panel for the same subtype (considered as ground truth in this comparison). (B) Performance of the classification. (C) Cases from the NCI cohort filtered into the IMPACT panel were classified by LymphGen into 6 subclasses (MCD, EZB, BN2, N1, ST2, A53). The cases with more than one assigned subclass are indicated as “Composite”. The cases that cannot be classified into these subclasses are labeled as “Other”. Regarding categories of the subclassification: tumors with subtype probabilities of >90% or 50-90% were defined as ‘‘Core’’ or ‘‘Extended’’ subtype members, respectively. (D) Correlation of LymphGen classification and cell-of-origin by Han’s algorithm. (E) Composition of “Core” and “Extended” group in each subtypes. (F) Confusion matrix of the IMPACT panel compared to the NCI panel for “Core” predicted group only. The target represents the classification by the NCI panel; the prediction represents the classification by the IMPACT panel. The center number shows the number of cases; the percentage represents the proportion of cases classified by IMPACT for a certain subtype in the cases classified by the NCI panel for the same subtype (considered as ground truth in this comparison). (G) Performance of the IMPACT panel compared to the NCI panel within the “Core” group. ABC: activated B-cell subtype; GCB: germinal center B-cell subtype.

