In the article pre-published online and in the March 2024 issue of Haematologica,1 we have to correct that:
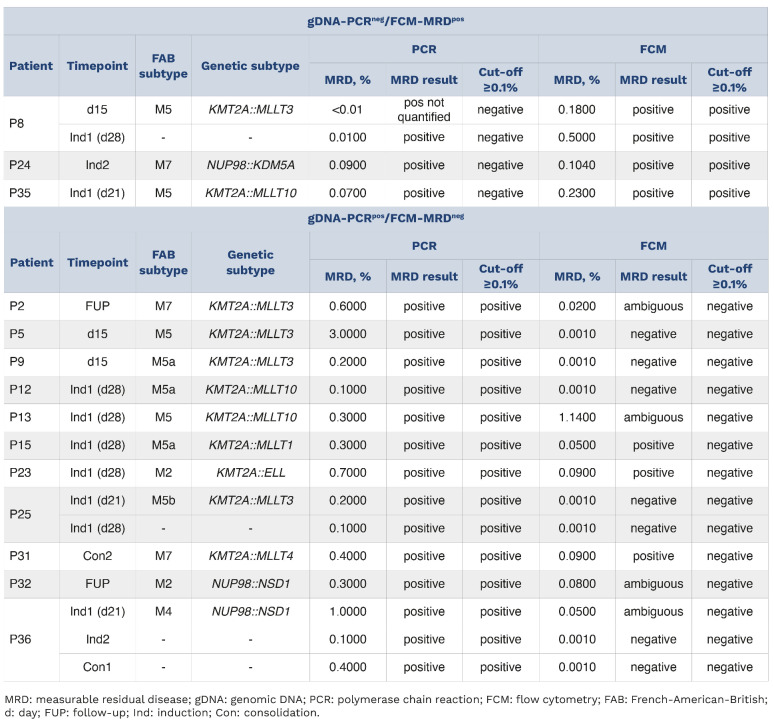
- Since the percentage minimal residual disease for patient 8 was 0.0100 at the first induction timepoint (day 28), the polymerase chain reaction minimal residual disease result should be “positive” instead of “negative” (Page 5, Table 1, P8, Column 6). In the main text on Page 5 the sentence “Three of these samples were positive by gDNA-PCR but below the threshold of 0.1% (Table 1)” should be replaced by “All of these samples were positive by gDNA-PCR but below the threshold of 0.1% (Table 1).”
Table 1.
Summary of cases with discrepant MRD votes between gDNA-PCR and FCM-MRD.
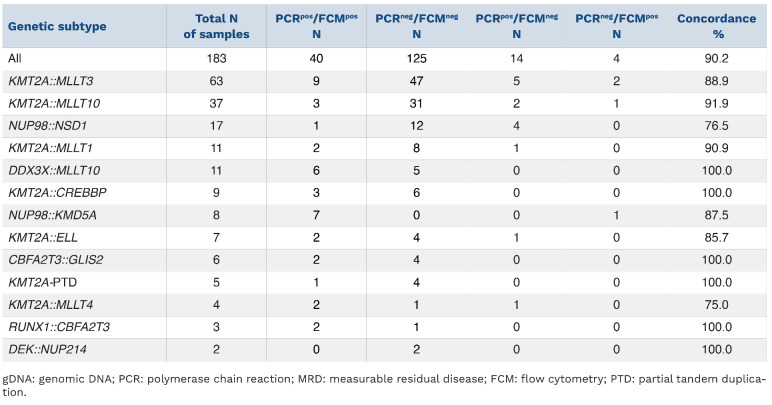
- In Table 2, the numbers in column 3 (PCRpos/FCMpos) apply to column 4 (PCRneg/FCMneg) and vice versa.
Table 2.
Concordance of gDNA-PCR MRD and FCM-MRD data based on genetic subtype. A threshoLd of >0.1% was used to define positivity.
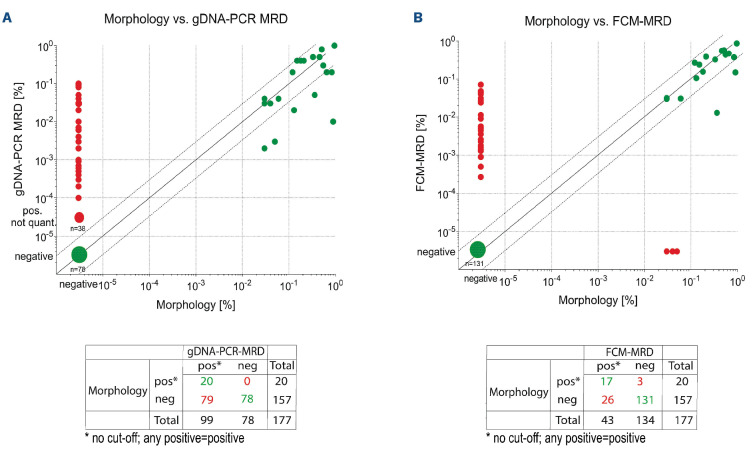
- No threshold was applied for the results shown in Figure 5, as described correctly in the main text (Page 8). Figure 5 itself contained an error, stating that a cut-off of 0.1% was used. The corrected Table 1, Table 2 and Figure 5 are shown below.
Figure 5.
Concordance of gDNA-PCR MRD and FCM-MRD with conventional morphological assessment. Each symbol represents one MRD estimate. Values that are MRD-positive or MRD-negative using both methodologies are considered concordant (green dots), whereas discordant samples are negative with one methodology but positive with another (red dots). In addition, dashed lines above/below the x=y line mark the range of variance according to Dworzak et al.,35 i.e. between 3x larger or smaller till 1/3 of the x=y value. Statistics performed using GraphPad Prism. gDNA: genomic DNA; PCR: polymerase chain reaction; MRD: measurable residual disease; FCM: flow cytometry.
The authors apologize for the errors and state that these do not change any scientific conclusions or interpretations of the data.
References
- 1.Maurer-Granofszky M, Köhrer S, Fischer S, et al. Genomic breakpoint-specific monitoring of measurable residual disease in pediatric non-standard risk acute myeloid leukemia. Haematologica. 2024;109(3):740-750. [DOI] [PMC free article] [PubMed] [Google Scholar]


