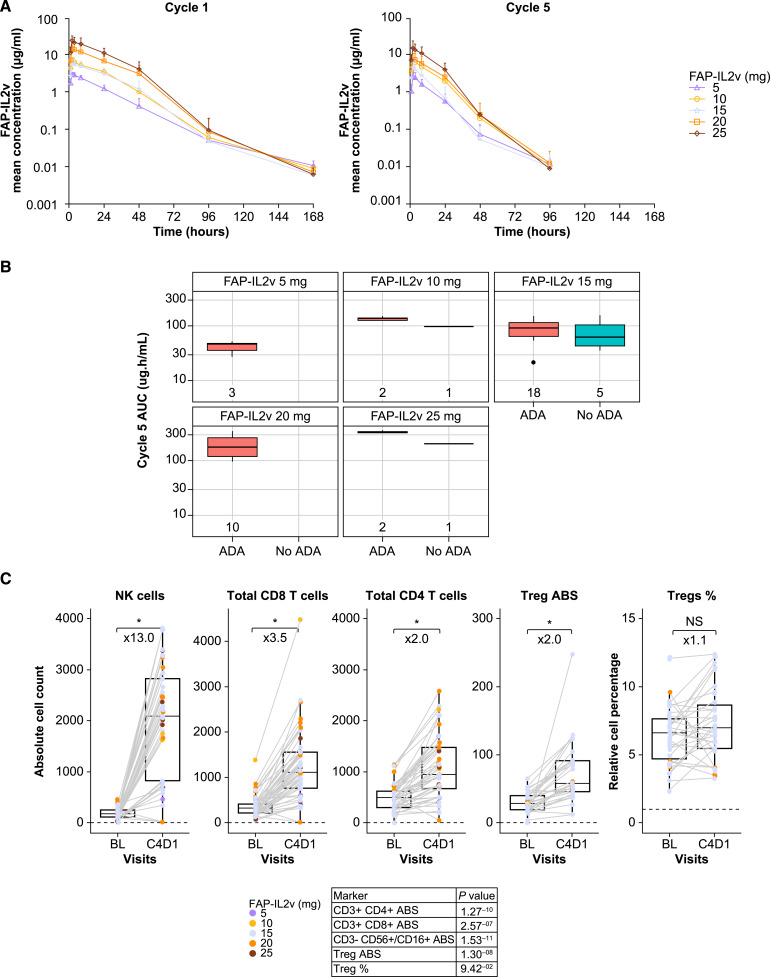
Figure 1.
FAP-IL2v PK profile on cycles 1 and 5 (A), exposure and effects of ADA development (B), and PD effects in peripheral blood (paired samples) following weekly administration (C). *, P < 0.01. ABS, absolute; AUC, area under the concentration curve; BL, baseline; C, cycle; D, day; NS, not significant.

