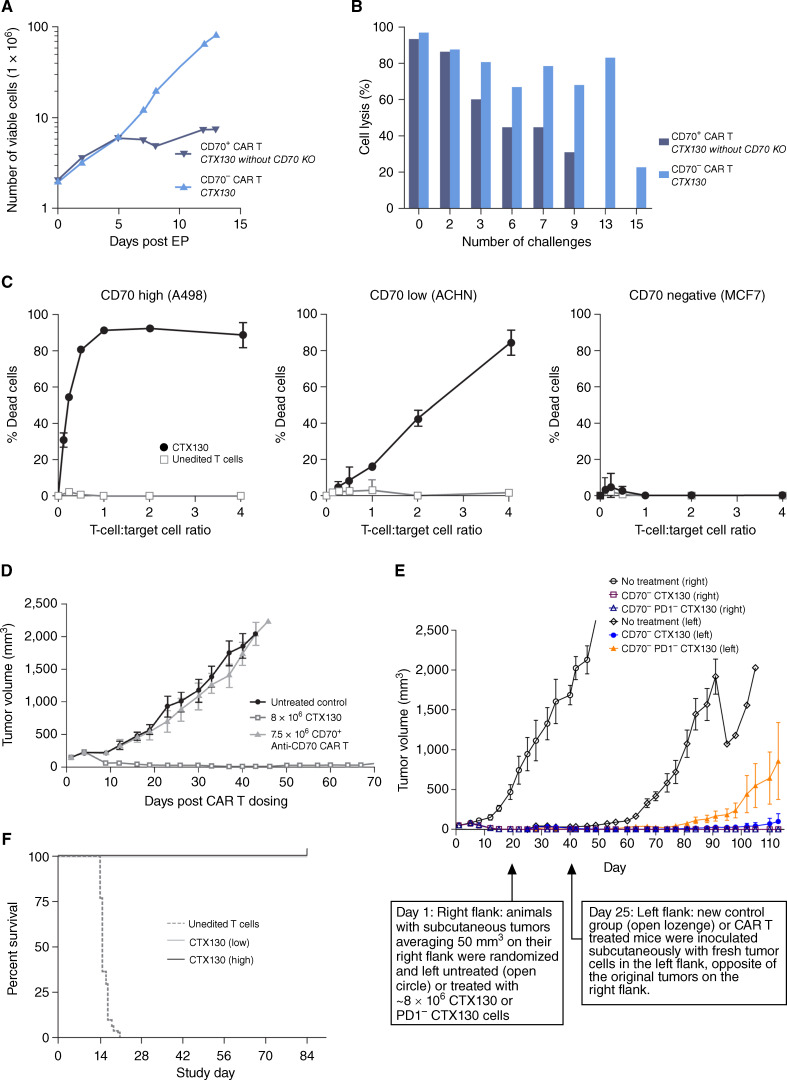
Figure 1.
Preclinical efficacy and antitumor activity of CTX130. A, Proliferation of CTX130 versus CD70+ CAR T cells. B, CTX130 and CD70+ anti-CD70 CAR T-cell cytotoxicity as a percentage of cell lysis after repeated challenges with CD70+ A498 cells. Data points represent a single measurement. C, CTX130 cytotoxicity toward CD70high (A498), CD70low (ACHN), and CD70− (MCF7) cell lines. Results from cells treated with CTX130 are shown with solid circles, and results from cells treated with unedited T cells are shown with open squares. The graph shows the mean ± SD from 3 technical replicates with increasing ratios of CTX130 or unedited T cells to tumor cells (0.125:1 to 4:1). D, Antitumor activity of CAR T cells in an RCC xenograft model. Mice were either left untreated (n = 5) or injected with CTX130 (n = 5) or CD70+ anti-CD70 CAR T cells (n = 4). Each point represents the mean tumor volume ± SEM. E, Disruption of the PD-1 checkpoint gene is detrimental to CTX130 CAR T-cell function in a xenograft rechallenge model. Following the first injection of tumor cells, mice (n = 5 per group) were left untreated (open circles) or treated with CTX130 (open squares) or PD1− CTX130 CAR T cells (open triangles). At the day 25 rechallenge, fresh tumor cells were injected into the left flank of treated mice (CTX130-treated and PD1− CTX130-treated animals represented by solid circles and solid triangles, respectively) and a new control group (open lozenges). Each point represents the mean tumor volume ± SEM. F, Mortality due to GvHD in mice (n = 30 per group) treated with unedited T cells or low (20 million cells/mouse) or high (40 million cells/mouse) doses of CTX130. CAR, chimeric antigen receptor; CD, cluster of differentiation; EP, electroporation; GvHD, graft versus host disease; KO, knockout; PD-1, programmed cell death 1; RCC, renal cell carcinoma.

